

How to Validate and Confirm Consumer-Reported Data to Determine Market Size
By Ken Donaven
NOTE: This is Part 2 of a three-part series on Market Size Analysis. Find Part 1 here and Part 3 here.
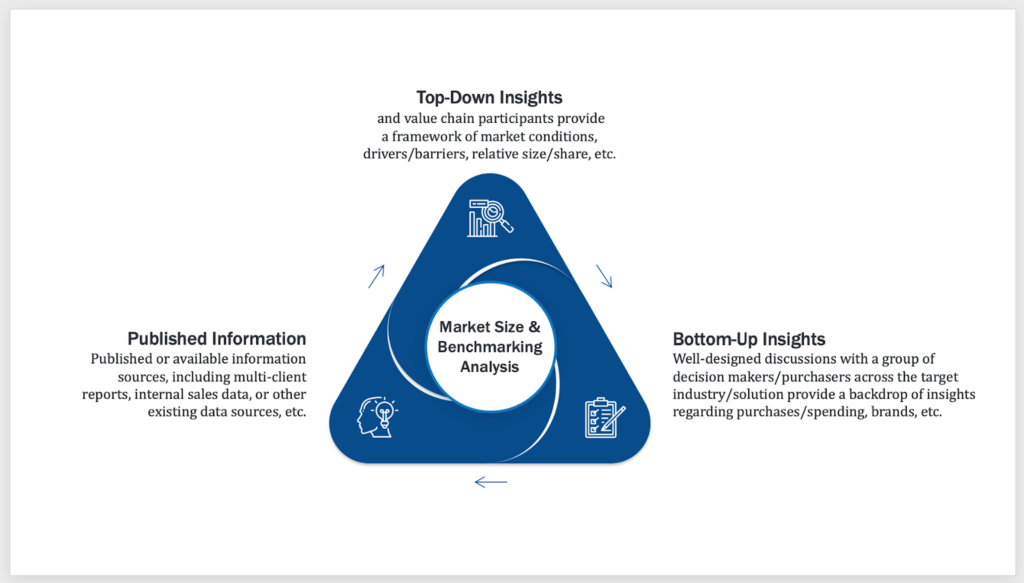
In a previous article, we discussed the importance of “triangulation” when conducting market size studies. The three legs of the proverbial triangulation stool include:
- Published data and reports
- “Bottom-up” insights
- “Top-down” insights
While “bottom-up” insights — surveying purchasers of products to extract data — are often used to perform market size studies, there is a danger in relying solely on this type of information-gathering alone. In absence of “top-down” insights — interviewing manufacturers, distributors, and players in the entire value chain — such results can return incomplete, misleading, or wholly incorrect conclusions and assumptions.
It is only through the combination of all three sources of information that one can triangulate a true, data-informed market size. Published data is useful but has its limitations and can become outdated, as previously discussed. Bottom-up insights reveal what was purchased. Top-down insights focus on what was sold.
When taken together and examined in totality, this intelligence triangle allows us to zero in on a much tighter, far more precise, and further validated range of a given market size. Without top-down analytics as part of the equation, one runs the risk of placing faith in two sources of data that have proven at times to be unreliable and substandard pictures of reality.
Non-Total Recall
One of the greatest limitations of bottom-up insights is that they rely heavily on humans’ memories as a source of information. People joke all the time that we can remember where we were on our first date 30 years ago but can’t remember where we left our car keys five minutes ago.
Consider that fact when working in surveys that ask respondents to recall with accuracy which products they bought, how often, and in what quantity over the course of a given year or years. This might be easy in some categories of goods and services, say, refrigerators or automobiles. But it can be much more difficult in categories such as daily consumables. You might be able to accurately recall in a survey when you purchased your last vehicle; but if someone were to ask you how much facial tissue you purchased over the past 24 months, how frequently you purchased it, what it cost you each time, where you purchased it, what brand name you purchased, and so on, how accurately do you suppose you could report those facts?
The same phenomenon is at work in manufacturing. An automobile purchase may be memorable for the consumer; but ask a tier-three supplier how many of a certain kind of fastener they purchased across multiple locations and at what price point, and you’ll likely get blank stares and wild guesses.
Keep in mind, when conducting market size, we are almost always venturing into the great unknown. It might seem counterintuitive, but most companies cannot tell you with certainty how large their existing markets are. Given that, it is very challenging to know with certainty whether you are gaining or losing market share at any given point. While you know your own company’s sales data, market growth could, in fact, be outpacing your revenue growth. What could look good in an internal spreadsheet may reveal vulnerabilities in the context of the broader market size data.
What’s more, this is especially important data to acquire when expanding into new markets. Even if you are satisfied that you have an acceptable understanding of your own market size (and even if this is imprecise), not fully understanding the size of a new market you endeavor to enter can be a recipe for disappointment…or even disaster!
Trust But Verify
A top-down approach to market sizing is key to validating and corroborating what gets reported when conducting bottom-up research — similar to a reporter seeking secondary sources for every lead or comment they get from a single source. The more exhaustive a top-down analysis is, the more diligent the corroboration of other data sources will be.
Top-down research is almost always qualitative in nature: this typically includes in-depth interviews with high-level respondents who can sometimes be difficult to reach, if you don’t have the processes and connections in place to gain access to the key players. Key success factors for a robust top-down analysis can include a wide variety of insights.
Explore the complete value chain. Martec endeavors to study the entirety of the supply, distribution and retail chain. We learn the key players up and down that entire spectrum and focus on several key questions: Who controls the market? Who are the secondary players? What is each player’s share of the market? Who is driving change/growth in the market? And many others..
Find what’s publicly available. Public companies are required to submit filings that are accessible and can be scoured for valuable intel regarding sales and other important data points. While these filings may not reveal revenue for a specific market, geography or product, they may provide valuable clues to that intelligence.
Talk to the experts. Consultants to a given sector are also great sources of reliable intelligence. Martec contacts relevant trade associations, analysts and other industry experts that provide expertise the major players within a given market either cannot or will not.
Apply the 80/20 rule. Many markets adhere to the 80/20 rule, in which 20% of businesses control 80% of the market — with consolidation, this is more today than ever before. It is important to bring the market leaders into the conversation and conduct in-depth qualitative interviews with industry experts at the largest players in the market.
Take nothing as gospel. There’s an old saying in journalism, “If your mother tells you she loves you, verify it.” The same might be said of the information gathered during market size studies. Without a fully triangulated approach, false claims and erroneous assumptions could provide faulty intelligence, jeopardizing the decisions your team makes when evaluating that data.
Putting the Pieces Together to Reveal the Puzzle
I often compare market size analysis to doing a jigsaw puzzle without the box top. You know there’s a picture there, but until you start putting all of the pieces together, you don’t really know what you’re looking at. As the pieces come into place, however, the image begins to reveal itself. And even if you’re missing a single piece here or there, you can extrapolate enough data from the pieces you do have so as to fill in the blanks.
In market sizing studies, the more pieces you can find, the clearer — and more reliable — the picture becomes. It’s no longer a puzzle but, in fact, a reliable picture of your market.
CONTINUE READING: Part 3 is here, “Proceed with Caution When Doing Market Size Analyses“
Ken Donaven serves as Senior Director with Martec. He can be reached at Ken.Donaven@martecgroup.com.