Adding the Use of Images in Emotion Intelligence Research to Gain Deeper Insights
By Emily Bielak and Chuck Bean
Ask anyone how they’re doing today and you’ll likely get a rote response of, “fine.” Or, “good”…”not bad”…”can’t complain.”
We tend to accept these noncommittal responses in our everyday lives, as we toss the question and response up to a polite exchange of pleasantries. But in market research — when much more is at stake — a half-hearted, non-intellectual, or reflexive but inaccurate response can do a great deal to compromise the integrity and actionability of the respondent data.
It’s not uncommon, even when conducting sophisticated research studies, to field what might be considered “generic” open-ended responses when you ask survey participants to describe how certain experiences or brands make them feel. “Happy.” “Good.” “Fine.” Taken alone and absent any further validation techniques, it can be challenging to decipher when you are getting the “canned” response and when you are receiving valid feedback. It may also be difficult to determine nuances such as the degree to which that sentiment applies, the passion or lack thereof, or the frequency, duration and persistence of the expressed emotion.
One of our recent innovations in our ongoing pursuit to optimize and perfect Emotion Intelligence research is the use of images in a “qual-then-quant” process to gain deeper and more authentic insights into how emotions and sentiment are driving purchase decisions (or not). If a picture paints a thousand words, offering research study participants another way — perhaps easier and more complete — to describe their feelings not only yields more meaningful results, but it can move the participant beyond the cookie cutter happy, good, fine responses.
Get the Picture?
The underlying premise of this innovation has roots in a technique known as “ZMET.” The Zaltman metaphor elicitation technique, as it’s known, is a methodology that attempts to elicit both conscious and unconscious thoughts by exploring people’s non-literal and metaphorical lobes of the brain. Written text and the spoken word can fail to fully activate those aspects of the mind. Adding images to the equation, however, stimulates those other neurons in ways that can connect emotionally to a person’s verbal description of an experienced sentiment.

The real potential for such image-based methodologies is when the basic premises of ZMET are built upon to employ more modern techniques and, specifically, the aforementioned Emotion Intelligence practicology.
This is not to say, however, that the use of images alone should replace written and verbally reported responses…only that the methodology can add depth, nuance and color to a given study, whether in consumer product categories or business-to-business service sectors. As we all know, human emotions are complex; the more we can do to inject science and “math” into the study of difficult-to-quantify expressions of personal sentiment, the more actionable the data becomes.
Which brings us back to “qual-then-quant”
One of the more useful applications of images in the data-gathering process is when we use them to take a virtually limitless number of emotions and distill them down to a sentiment set that we feel will be most relevant and the most insightful for a particular study.
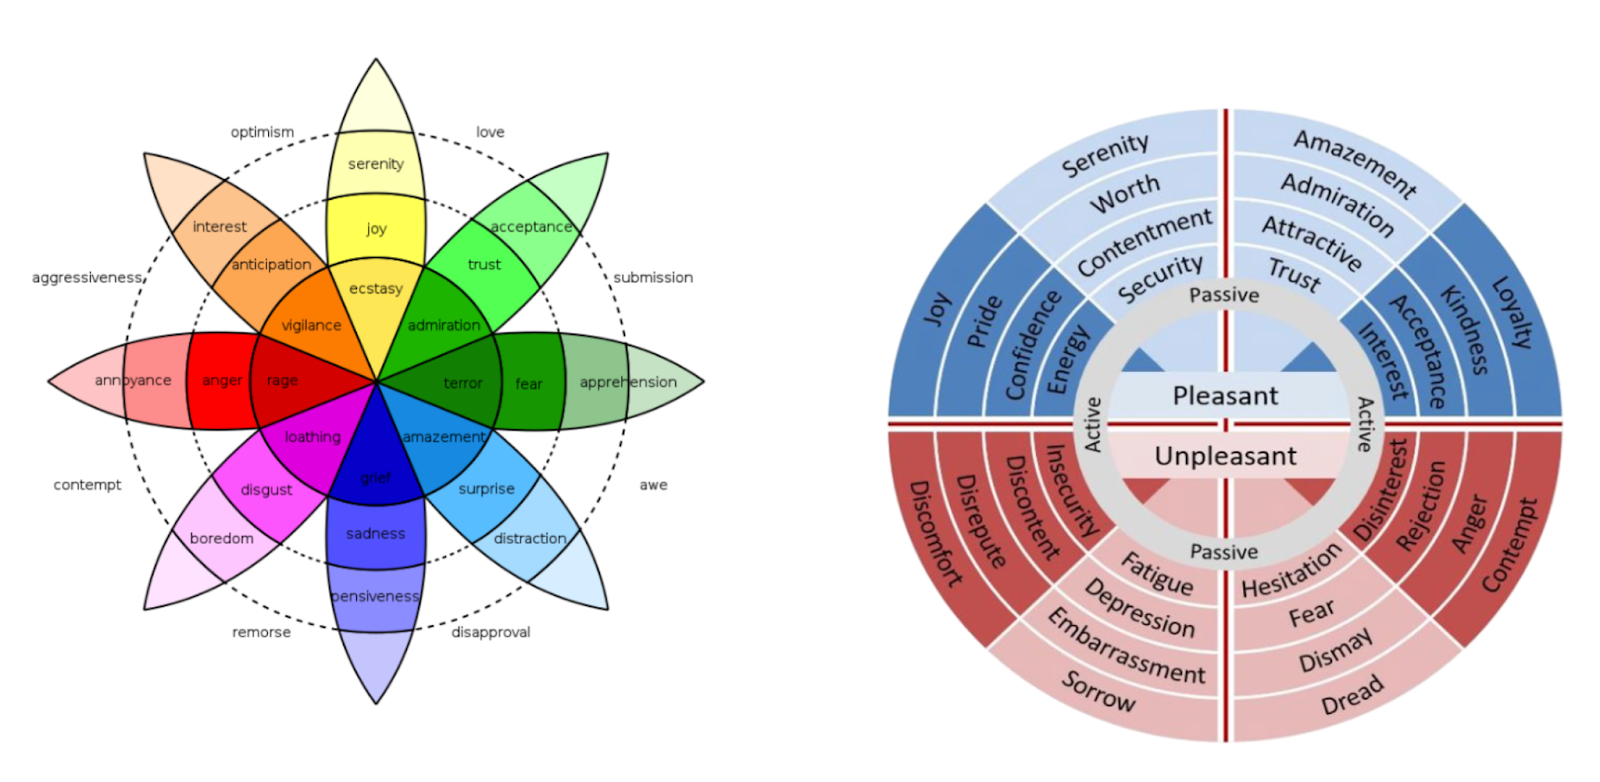
The Martec Emotion Wheel, which builds upon Plutchik’s Wheel of Emotions, yields 32 emotion channels:
Before designing a written survey, we can begin with an exploratory qualitative research phase to have people use and respond to images as a way of talking through their emotional states during various experiences or exposures to a brand, product or service. Once we have enough data, we then use the results of those conversations to inform the design of the survey instrument. Often, the initial qual phase allows us to zero in on a select number of expressed emotions, and focus the survey questions on that sentiment set alone, rather than have the study be completely open-ended (which can result in too much information).
This qual phase may also empower the researchers to take what would otherwise be a 32-channel emotion landscape and pare it down to an emotion landscape with eight channel groups — more manageable, more focused, and more purposeful.
The next phase — the quantitative research survey — is, as a result, more precise and intentional. Rather than proverbially asking a friend how they’re doing today, you’re effectively asking someone to describe an experience using specific trigger emotions that have an actual impact on the decision to purchase. The survey design can now use closed-ended questions in the quant phase, which saves time and provides better, more impactful and actionable data on the back end of the ultimate analysis. Importantly, the research team is now able to quantify respondents’ authentic and deeply experienced emotions — something quant research is obviously well-suited to deliver.
In a perfect world, a third phase is included: the follow-on qualitative phase. Knowing, again, that emotions are complex nuances experienced by complex human beings, a follow-up qualitative exercise might include asking individuals or smaller, select groups of respondents to provide more in-depth explanations or stories related to specific emotional drivers of purchases and customer experiences. The survey should now have provided clarifying context relative to very specific and authentic sentiments — no more happy, good, fine — and the qualitative researchers can dig deeper and rely on informed intelligence when asking questions about what might otherwise be “nebulous” subject matter, such as “feelings.”
A Picture Paints…
Zaltman began thinking about the power of using imagery in research while on vacation in Nepal in 1990. He initially planned to bring his camera to chronicle his trip. At the last minute, he decided to give local residents disposable cameras and asked them to take pictures that would explain what life was like in their villages. After developing the pictures, Zaltman returned to the village to ask residents to explain, through an interpreter, the meaning of the photographs. The imagery tended to reveal ideas that would have been difficult or impossible to put into words.
That phenomenon remains true to this day. It’s not, typically, that people are trying to hide their emotions…or lie to surveys. It’s just that humans often need to be nudged (and nudged again) to fully and freely express their full range of emotions.
As researchers studying the very nuanced but intrinsically critical role that emotions play in customers’ purchasing decisions, we remain committed to exploring innovations in the practice of Emotion Intelligence. Anything that empowers us to deliver richer, more meaningful, and more data-informed analysis to clients weighing critical strategic decisions is something we will continue to explore and iterate upon — the use of images included.
“Tell us how you really feel.” It’s a sarcastic jest employed when someone shares too much of their inner sentiments. But that’s exactly what we, as insights professionals, are in dogged pursuit of.
Only now, it’s not only “tell us”…it’s “show us” as well.