

How Smart Investors Use Competitive Analysis to De-Risk Deals and Build Value Creation Playbooks
Three weeks into a competitive analysis for a lower-middle-market deal, we pulled up a share chart that made the seller’s growth story impossible. The target claimed 30% market share in a growing category. Our primary research showed the real number was closer to 14%—and the gap was widening. That single finding triggered a repricing event that saved the investor millions.
This is what competitive intelligence does in commercial due diligence. Not a nice-to-have slide deck of competitor logos—a fundamental pressure test of the investment thesis.
Why Competitive Intelligence Is a Non-Negotiable in CDD
Competitive analysis, benchmarking, and positioning are critical building blocks underpinning effective commercial due diligence. Without the context of other players’ share, growth trajectories, capabilities/resources, intellectual property, and go-to-market strategies, growth estimates and feasibility assessments are likely inaccurate. Simply put: you cannot understand a company without understanding the field on which it plays.
Investors typically approach competitive intelligence with a core set of questions:
- Who does the target compete against—directly and indirectly?
- How is the target viewed in the market relative to competitors?
- Who has seized market share, and who is losing it?
- What differentiates this business, and is that differentiation defensible?
- What does the competitive landscape tell us about pricing power, margin sustainability, and the threat of disruption?
- Are there competitive dynamics (consolidation, fragmentation, new entrants) that fundamentally change the thesis?
Some of these questions sound simple. In practice, answering them accurately requires structured primary research, deep secondary analysis, and the pattern recognition that comes from having done this across hundreds of deals. Some market dynamics are also inherently competitive—the degree of saturation, the pace of expansion or contraction, the behavior of adjacent players—and understanding these forces is essential to the investment decision.
What Competitive Share Really Tells You
Most investors are familiar with competitive share as a concept: the target’s applicable revenue expressed as a percentage of the total market. This most basic form of share analysis typically translates into a pie chart and a conversation about who’s winning and who’s losing.
But that is far from the whole story.
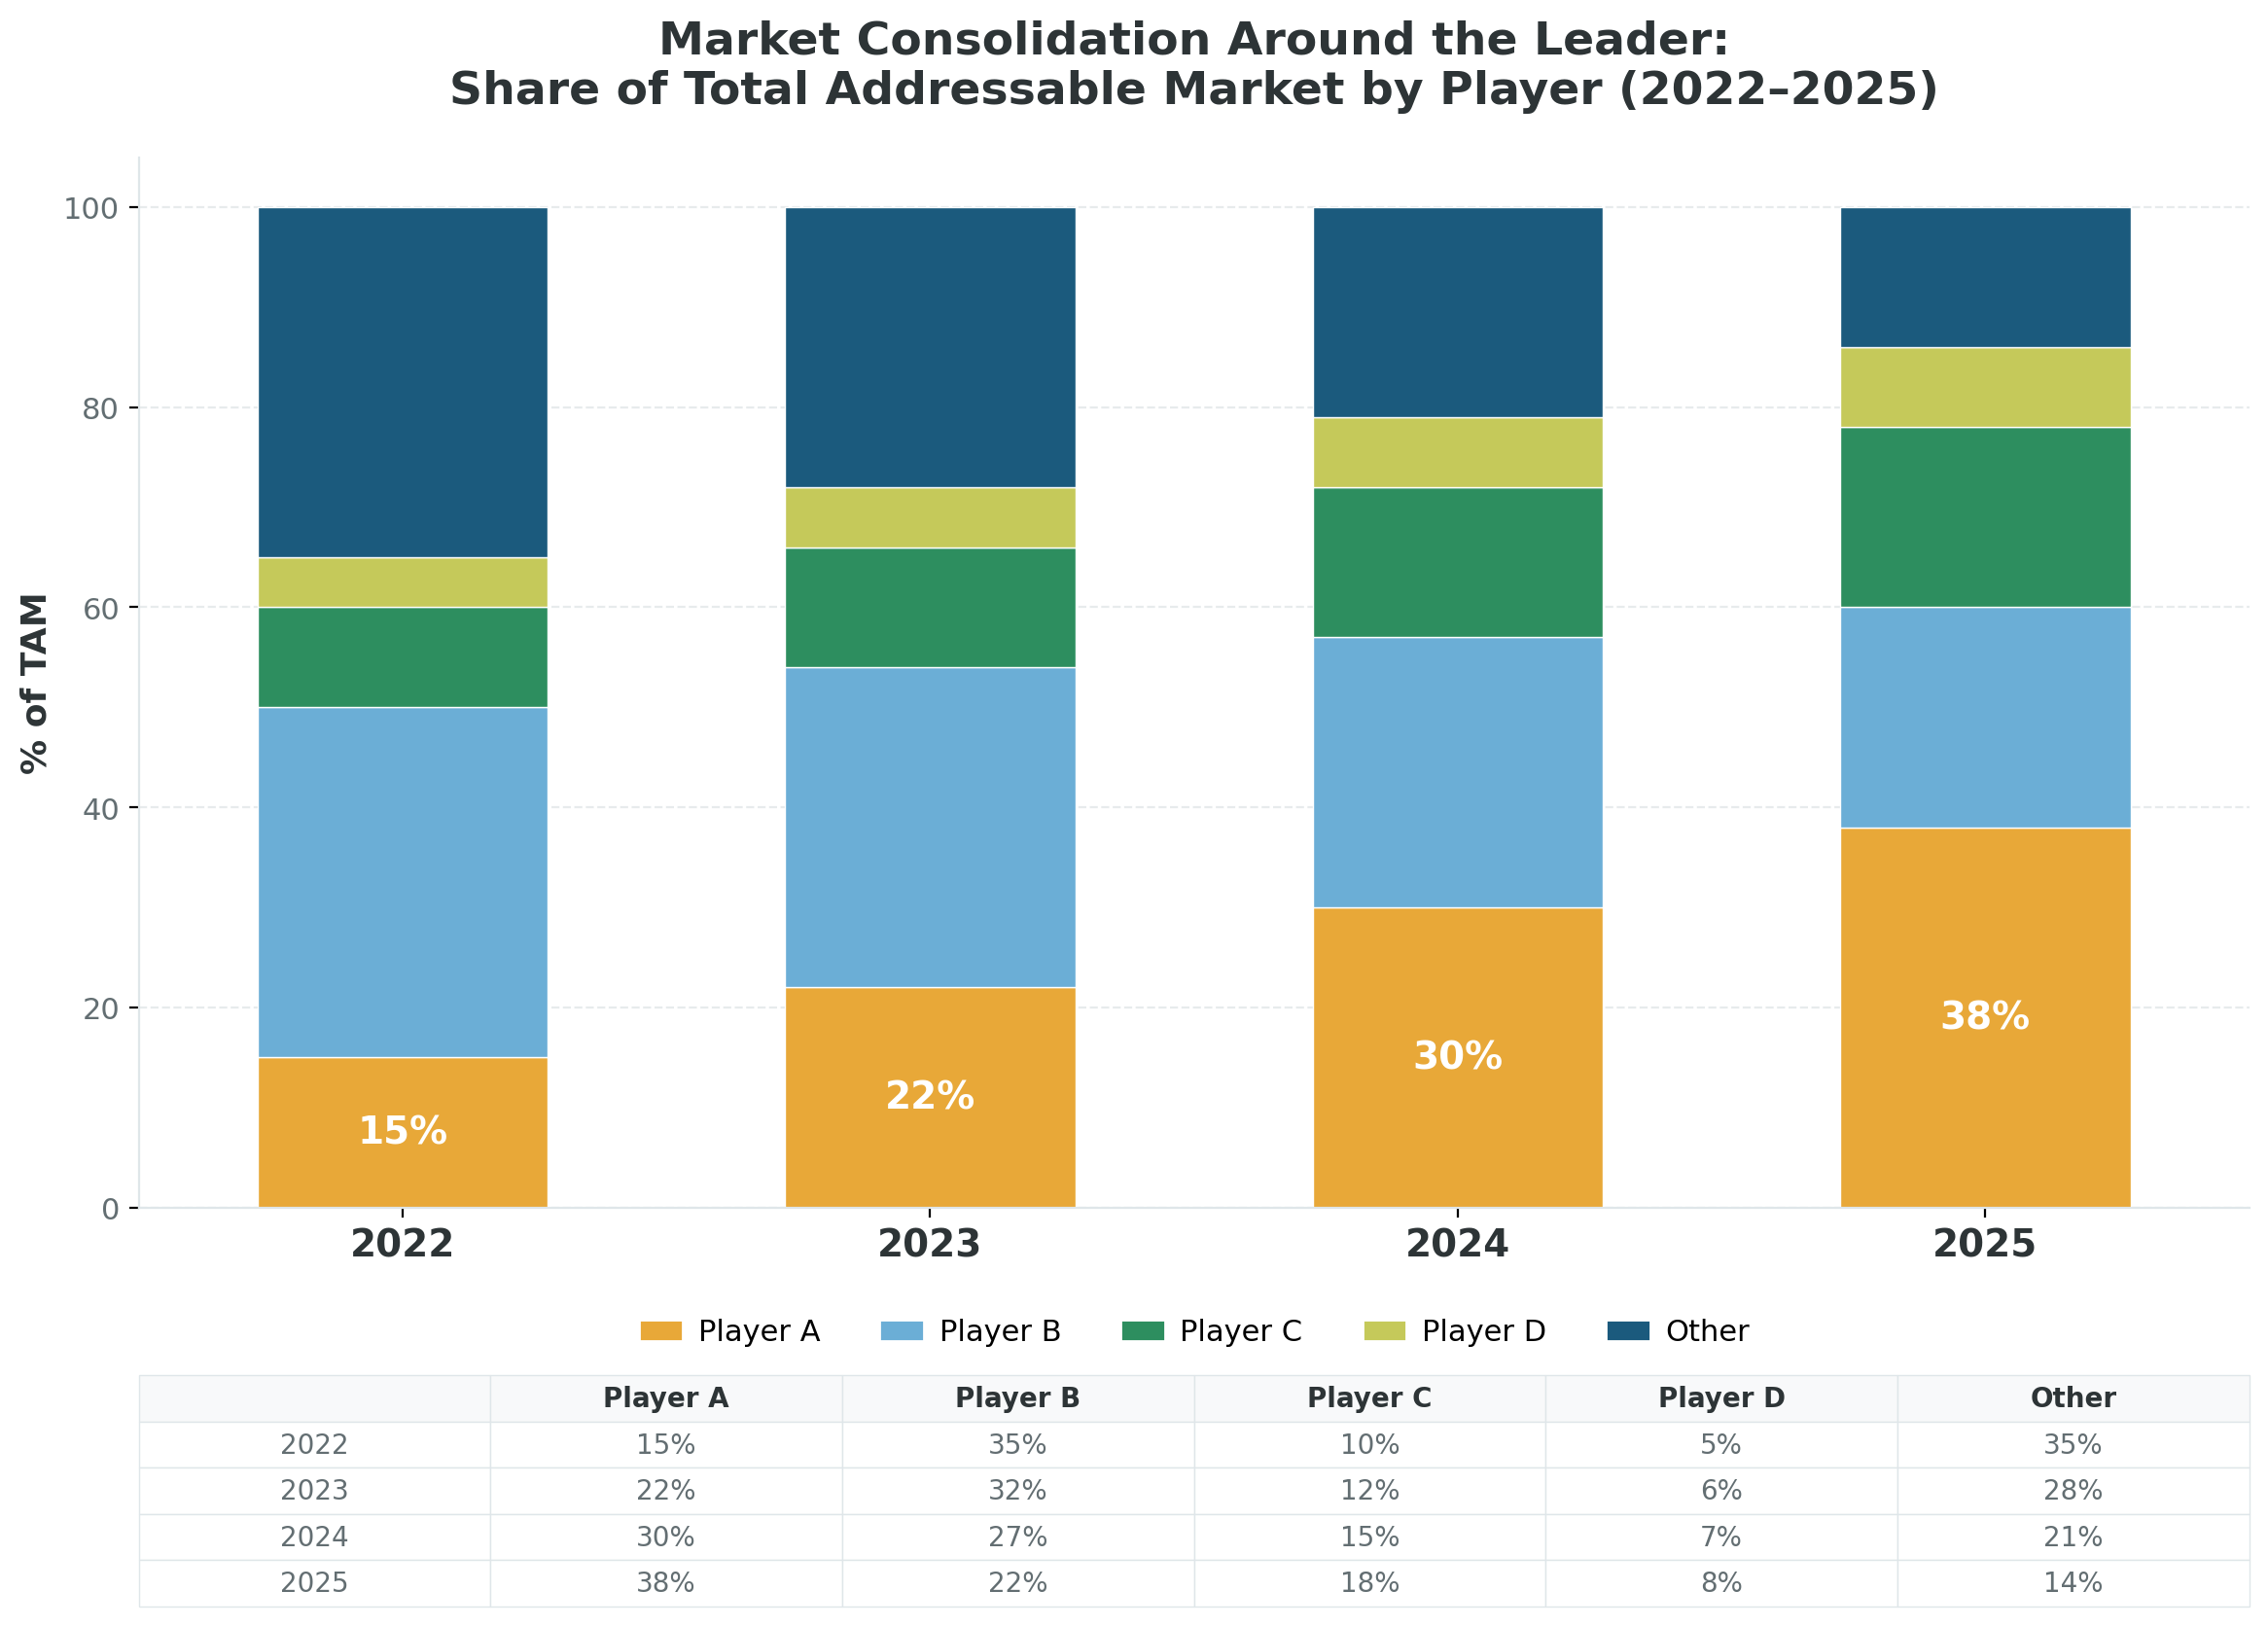
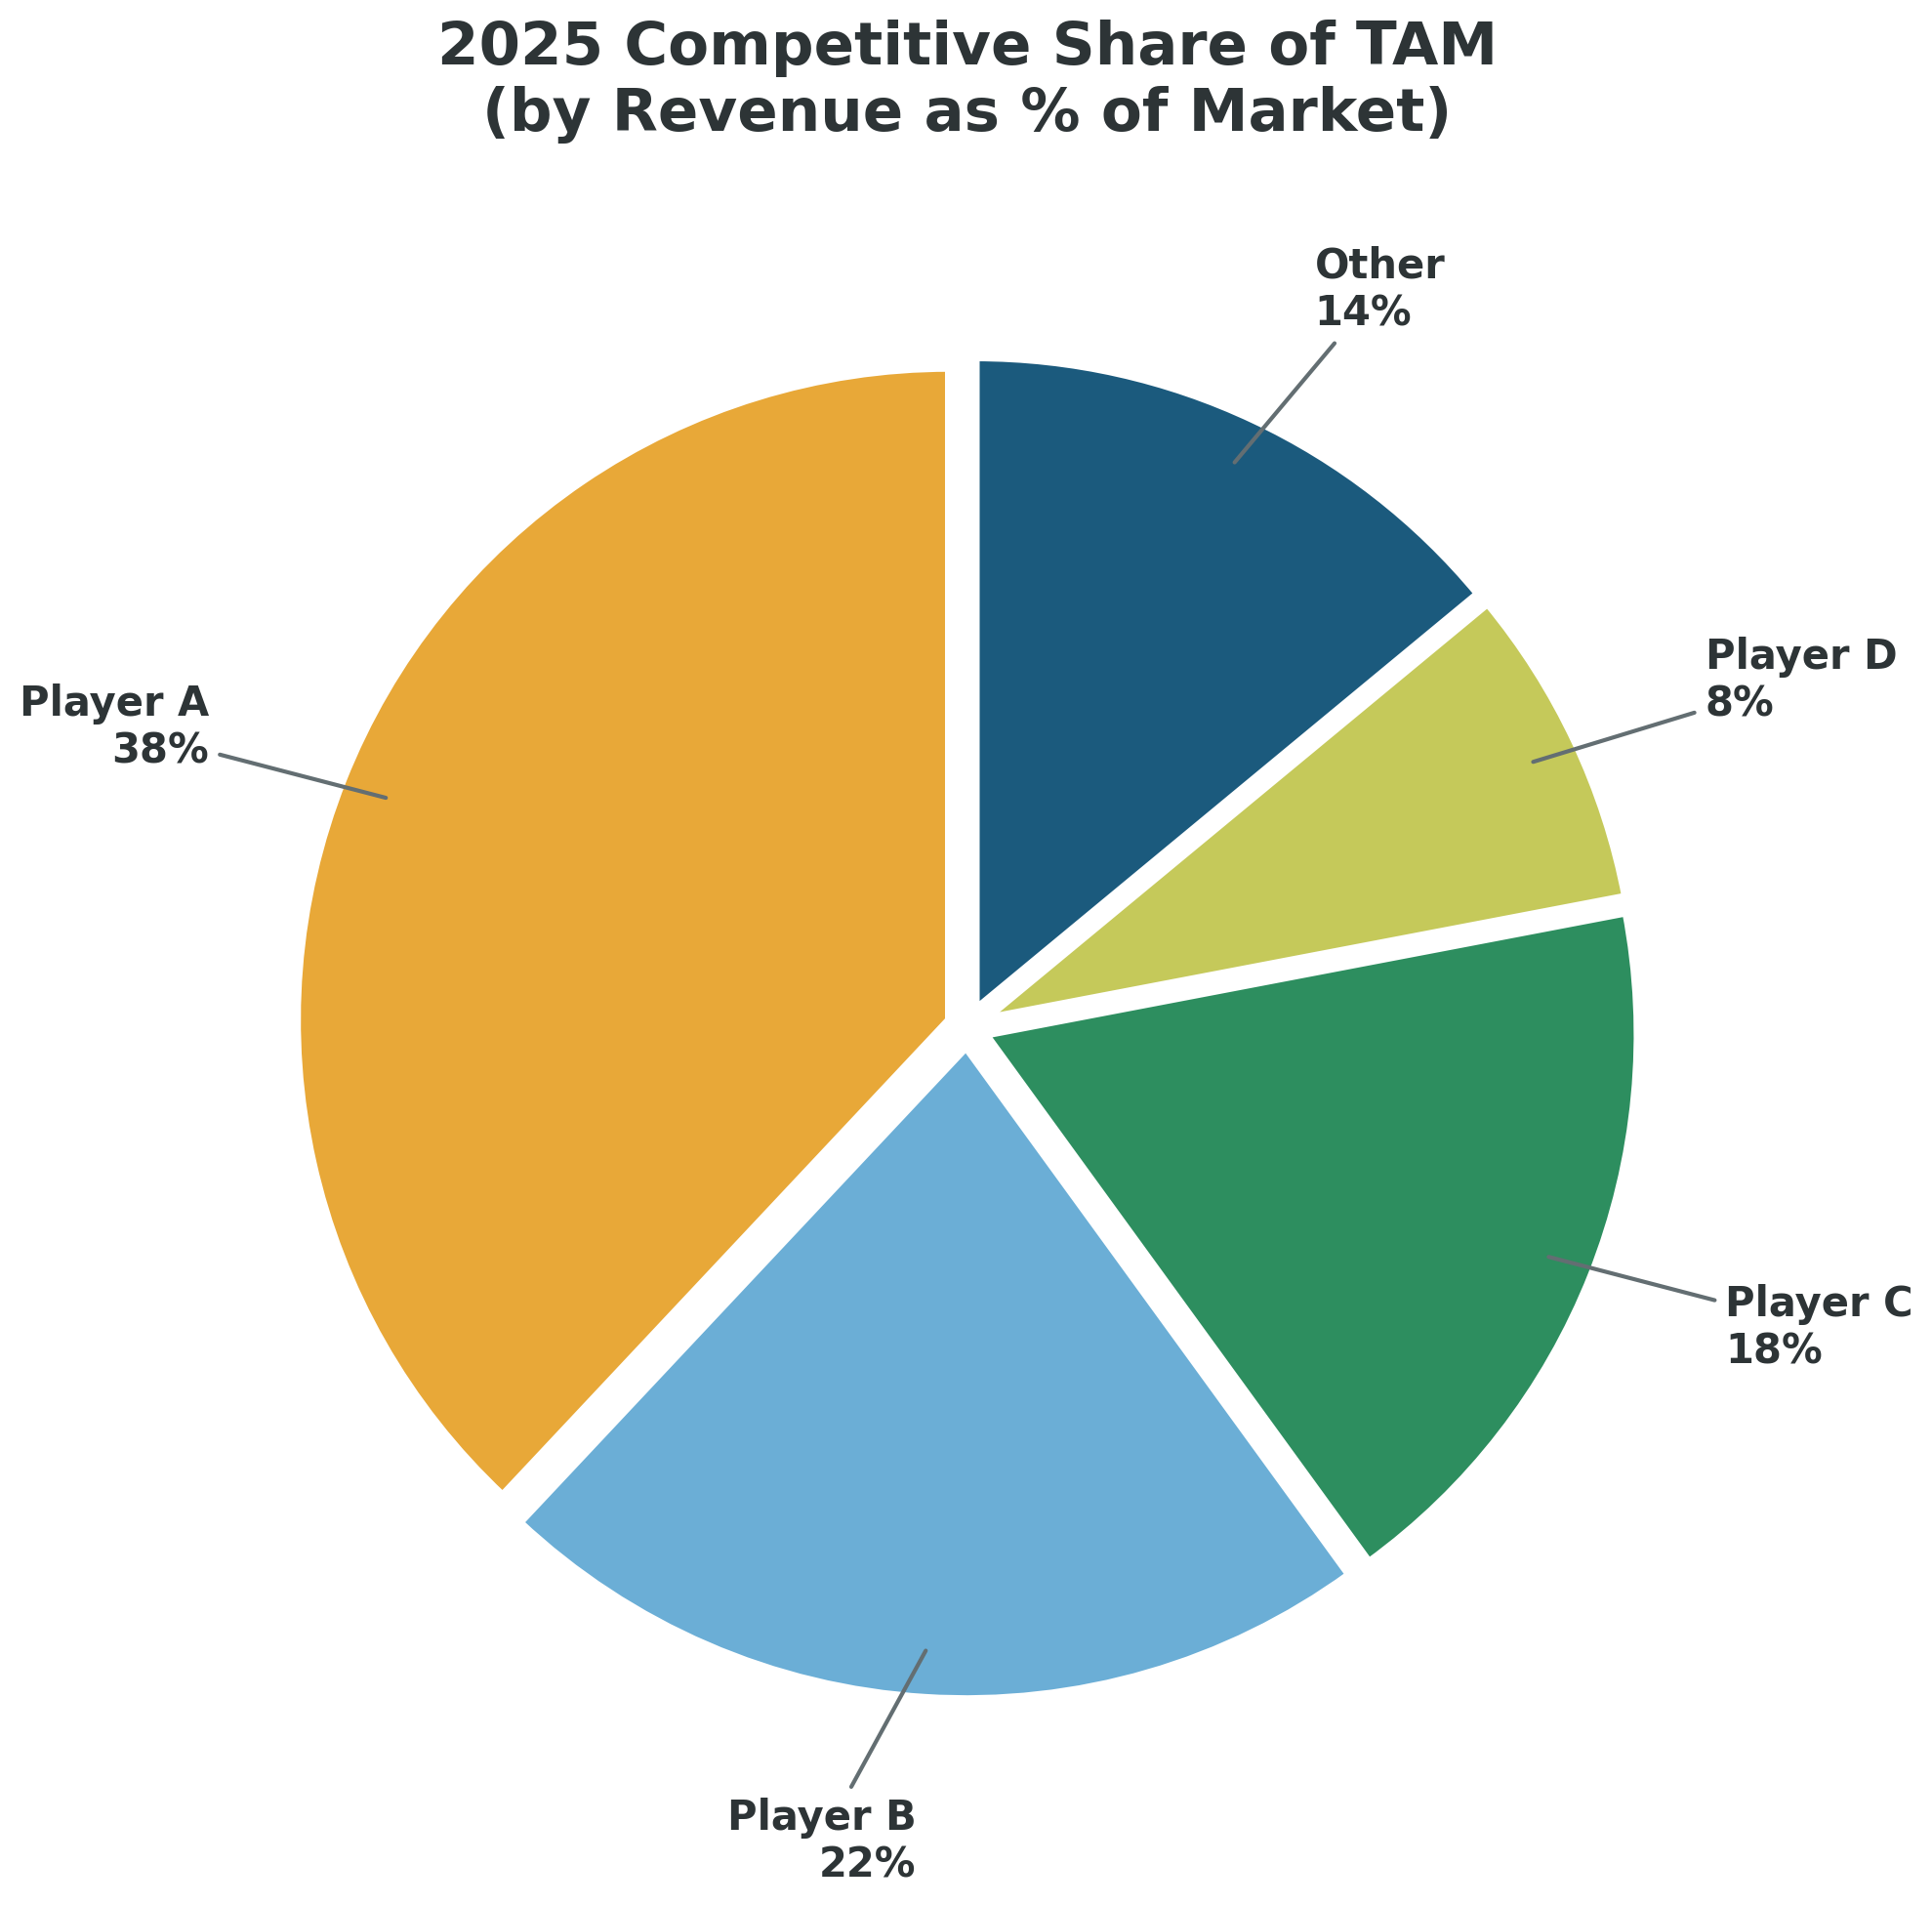
Figures 2–3: Tracking competitive share over time reveals market consolidation dynamics that a single-year snapshot would miss.
Investors benefit from an accurate understanding of competitive share because it reveals the nature of the market itself. The most revealing competitive share analyses track three or more years of movement so you can map how the market is evolving, how key players are jockeying for position, and whether the industry is consolidating, fragmenting, or stabilizing. Continued fragmentation, for instance, decreases profit margins as new competitors arrive and pricing pressure increases.
Beyond Revenue Share: Five Lenses on Competitive Position
The common understanding of competitive share is helpful, but it should not be the only way you evaluate the relative standing of players in a market. Depending on the industry and the nature of the target’s offering, the following additional measures often surface insights that revenue share alone would miss:
| Share Lens | What It Measures |
| Revenue Share | The percentage of applicable revenue captured by the firm relative to the total market value—the traditional metric |
| Volume Share | The volume of product or solution sold relative to total volume in the market (annual basis)—critical where pricing varies widely |
| Shelf Space / Visibility | The percentage of physical or digital shelf space the brand occupies—particularly relevant for B2C and retail-adjacent businesses |
| Mindshare / Brand Awareness | Aided and unaided awareness among potential buyers—measures the brand’s presence in the consideration set before a purchase decision is made |
| Capacity Share | Of the total in-kind product that could be produced annually given all players’ capacity, what percentage can this firm produce?—reveals upside ceiling and utilization dynamics |
In one engagement, a target’s revenue share appeared healthy at roughly 18% of their niche, but capacity share analysis revealed they were already operating at 92% utilization while their nearest competitor was at 64%. That single data point reshaped the growth thesis—the target’s path to capturing additional share required significant capital expenditure that wasn’t in the original model.
In Practice: When Shelf Share Tells a Different Story Than Revenue Share
In a recent engagement involving a CPG manufacturer selling across grocery, big-box, and convenience store channels, revenue share painted an incomplete picture of the target’s competitive position. The target held a respectable revenue share in its niche, but the more telling metric was shelf space—the percentage of physical shelf real estate the brand occupied at key retailers relative to the competitive set.
In CPG categories, shelf share is often a more powerful indicator of long-term competitive health than revenue share alone. Shelf placement drives consumer visibility, impulse purchasing, and brand reinforcement at the point of sale. When we engaged category leaders, retail buyers, and procurement decision-makers through our primary research, a critical dynamic emerged: shelf allocation decisions in this category were influenced more by trade spend commitments, distribution logistics, and category management relationships than by product quality and pricing alone.
The diligence effort mapped how shelf decisions were actually made—who controlled placement, how frequently planograms were reviewed, and what percentage of SKU-level shelf space each competitor held across retail formats. The result was a clear view of competitive positioning that identified both a vulnerability (the target’s underinvestment in trade spend relative to a key competitor) and an opportunity (several regional chains where shelf expansion was available with the right go-to-market push). These insights directly informed the post-close value creation plan. Within the first year post-close, the operating team executed a targeted trade spend reallocation that expanded shelf presence by 15% in the identified regional chains—directly tracing back to the competitive intelligence findings.
Identifying and Validating Competitive Advantages
“The most important thing in evaluating businesses is figuring out how big the moat is around the business.”
— Warren Buffett
In every deal, the question is not merely whether the target has advantages—it is whether those advantages are durable, measurable, and defensible against the specific competitive forces present in their market. As Buffett has also noted, it is the durability of the competitive advantage that creates all the wealth.
There are two overarching advantages worth testing in any deal. First, we establish which of these advantages the firm possesses. Second, we identify the source(s) from which that advantage originates.
Two Overarching Advantages
At a fundamental level, competitive barriers boil down to one of two dynamics:
- The firm can deliver or produce products and services more cheaply than competitors (cost advantage)
- The firm can access customers that competitors cannot access (demand advantage)
Most competitive advantages that hold up under diligence scrutiny can be traced back to one of these two dynamics. However, these can map to one or more of five common sources that present such key advantages, as discussed in the next section.
The question we always press on is: does this advantage translate into actual pricing power, margin protection, or customer retention—or is it a narrative that doesn’t show up in the financials?
Five Sources of Competitive Advantage
The target’s moat—if one exists—typically originates from one or more of the following five sources. The castle-and-moat metaphor is well-worn in investing, but the question we press on is specific: how wide is the moat, have the walls been tested, and are the defenses effective against the specific threats in this market?

Figure 4: The Castle and Moat—How Wide Is the Moat?
| Source | Description | CDD Diligence Test |
| Intangible Assets | Brands, patents, regulatory licenses, proprietary data, or institutional knowledge that competitors cannot easily replicate | Customer interviews on brand preference; patent landscape analysis; regulatory barrier mapping |
| Cost Advantage | Structural cost efficiencies from scale, location, process, or proprietary technology that allow the target to produce at lower unit cost | Benchmarking COGS, labor costs, and operational efficiency against top 3–5 competitors |
| Economies of Scale | The target operates at a scale where fixed costs are spread across sufficient volume to create a per-unit advantage | Capacity utilization analysis; breakeven modeling; comparison of fixed cost structures across players |
| Network Effects | Each additional user or participant on the platform increases value for all other users, creating a self-reinforcing growth cycle | User growth trajectory analysis; engagement metrics; platform stickiness and churn data |
| Switching Costs | Customers face material cost, disruption, or risk in changing to a competitor’s solution—whether financial, operational, or psychological | Customer interviews on willingness to switch; contract analysis; integration complexity assessment |
We want to know which companies have competitive advantages, which types of advantages they have secured, and how those advantages stack up against the target’s competitive set. But identifying the presence of an advantage is not sufficient for decision-making. We must also measure the strength and durability of each factor. We are asking how wide the moat is, whether the walls have been tested, and whether the defensive technologies are effective against the specific opposition on the field.
In Practice: When the Moat Turns Out to Be a Puddle
In a CDD engagement for a regional aggregates business, the seller’s CIM presented a compelling narrative: strong geographic positioning, high barriers to entry from permitting requirements, and a dominant share of the local market. On paper, the castle looked well-defended.
Our competitive intelligence told a different story. Through primary research with customers, competitors, and industry participants, we uncovered that a neighboring competitor was offering comparable product quality at a better price point and had sufficient capacity to serve the target’s core geography. The supposed geographic defensibility—one of the seller’s key value propositions—was significantly weaker than the CIM suggested.
The analysis also revealed that the total addressable market for the target’s primary products was materially lower than the CIM had represented. The seller’s TAM calculation included adjacent product categories and geographic zones where the target had no realistic path to capture share, inflating the growth story.
The combined effect of these findings—competitive pressure from a capable rival with better pricing and an overstated TAM—gave the investor the evidence needed to renegotiate. The result was a significant repricing event that adjusted the deal terms downward to reflect the actual competitive reality. This is exactly the kind of outcome where the investment in competitive intelligence pays for itself many times over: the cost of the diligence was a fraction of the repricing, and it prevented the investor from overpaying based on a narrative that did not hold up under scrutiny.
Applying Porter’s Five Forces in CDD
Porter’s Five Forces framework is a standard toolkit for evaluating industry dynamics. In CDD, we apply it with a specific lens: is the target’s growth and margin plan structurally defendable?
The framework helps us locate where power sits in the market—among customers, suppliers, rivals, entrants, or substitutes—and translate that into underwriting implications. While the most direct application is measuring the overall attractiveness of a market, we find it equally valuable to apply the framework to individual players (targets and key competitors) to assess the competitive differentiation of each firm.
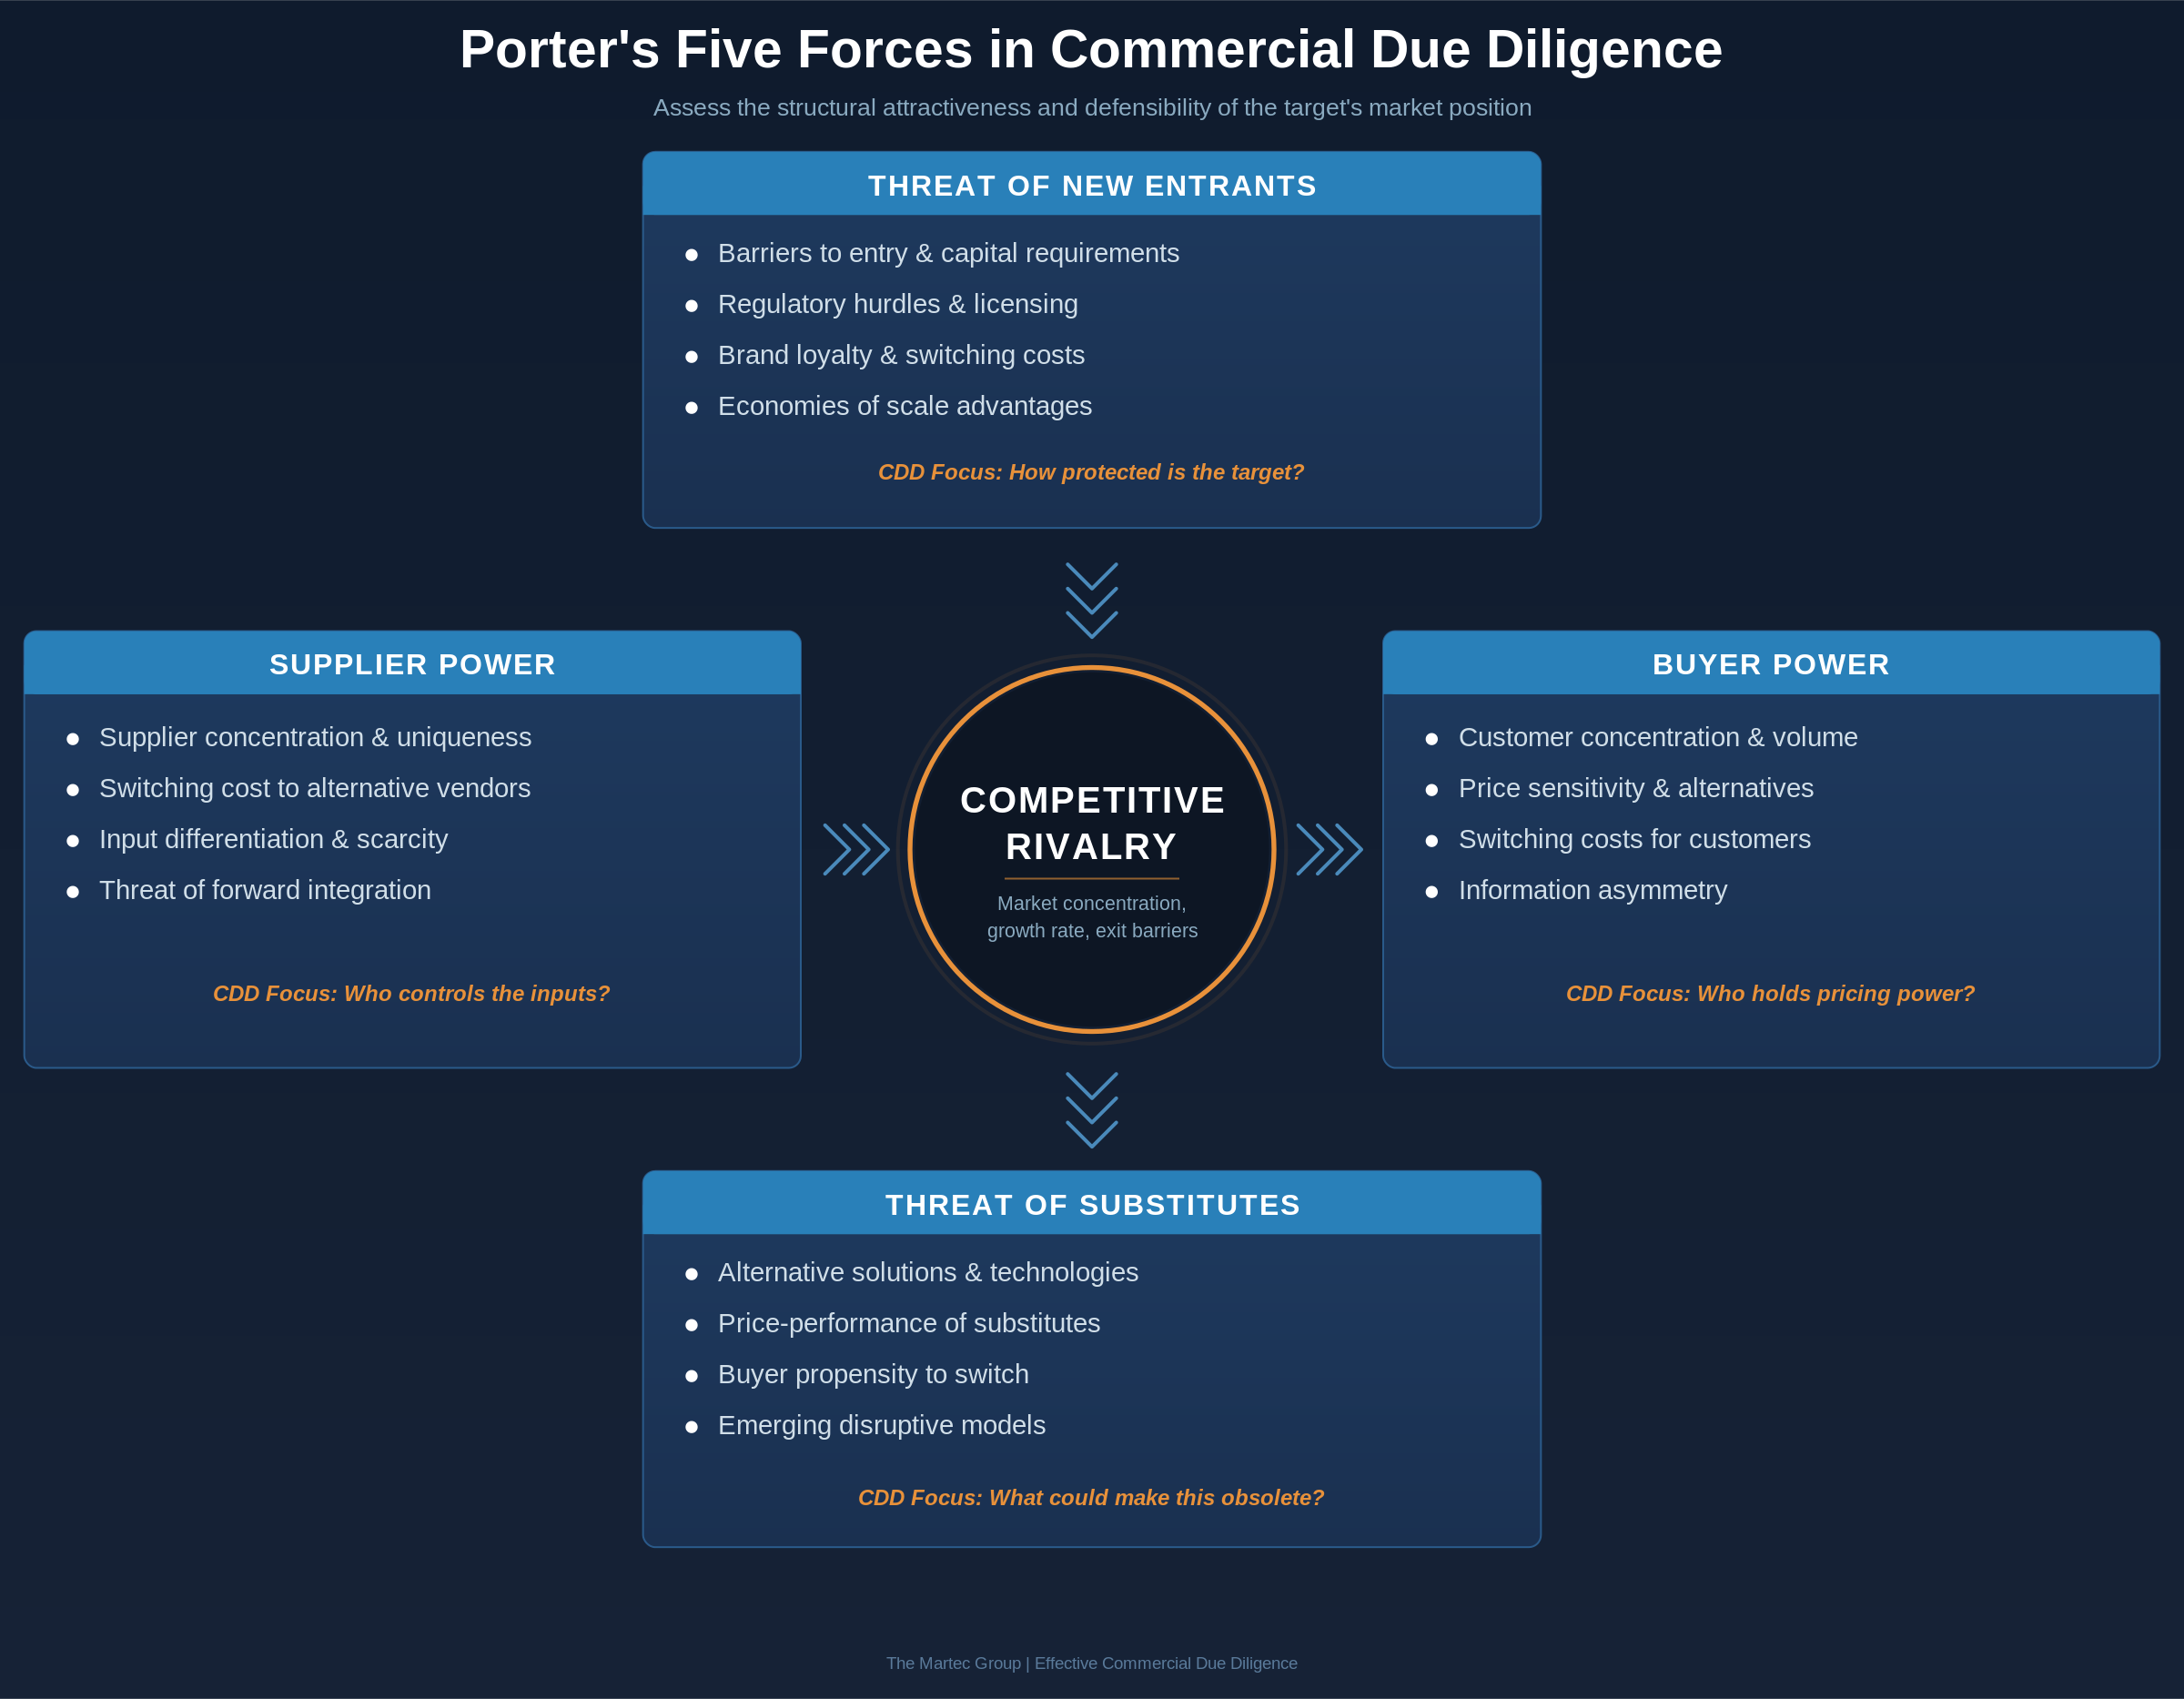
Figure 5: Porter’s Five Forces Applied to Commercial Due Diligence
The Five Forces at Work in CDD
1. Competitive Rivalry
How intense is the competition in this market? Are there a few dominant players competing rationally, or is it a fragmented field with aggressive discounting? The nature and intensity of rivalry directly impacts pricing power, margins, and the target’s ability to grow without giving up economics.
2. Threat of New Entrants
What are the barriers to entry? If barriers are low, today’s market share can erode quickly. We evaluate regulatory requirements, capital intensity, brand loyalty, distribution complexity, and the degree to which incumbents benefit from scale—all of which determine how protected the target’s position is.
3. Bargaining Power of Suppliers
When suppliers hold disproportionate power—due to concentration, switching costs, or the uniqueness of their inputs—the target’s cost structure becomes vulnerable.
In Practice: How Supplier Dynamics Shaped a Production Strategy
In a CDD engagement for a B2B manufacturer of a labor-intensive product, competitive intelligence on supplier and production dynamics proved to be one of the most consequential outputs of the entire diligence effort. The target was evaluating multiple strategic options: shifting production to a foreign facility, opening a second domestic plant, or engaging co-packers and co-manufacturers to supplement capacity.
Our analysis benchmarked production economics across each option, incorporating competitive intelligence on how peer firms in the space were approaching similar decisions. We interviewed co-packer operators, evaluated foreign production cost structures, and assessed the operational risks of each path—including lead times, quality control challenges, and the impact on customer relationships.
The competitive benchmarking revealed that several peers had already tested foreign production shifts and experienced quality and delivery issues that eroded customer trust. Meanwhile, the co-packer landscape offered a viable near-term solution with lower capital commitment, but only with specific vendors who met the target’s quality standards. The analysis gave the investor a clear-eyed view of production strategy options, enabling the post-close team to make an informed decision on how to scale capacity without inheriting the operational risks that had tripped up competitors.
4. Bargaining Power of Customers
Customer concentration, the availability of alternatives, and the importance of the target’s product to the buyer’s own operations all influence how much pricing leverage exists. In many lower-middle-market deals, we find that the relationship with two or three large B2B customers can completely change the financial outlook of the company.
5. Threat of Substitutes
Can the customer’s need be met by an entirely different type of solution? This force is often underestimated in CDD because deal teams are focused on direct competitors rather than the broader ecosystem of alternatives. We evaluate whether technology shifts, changes in buyer behavior, or adjacent industry disruptions could make the target’s offering less relevant over the hold period.
Key Insight: Five Forces Answer Four Critical Questions for Investors
- What makes this industry profitable, and to what degree?
- Where can the target (or the resulting business combination) find defensible and profitable positioning?
- Which forces impact the nature of this industry beyond the activities of direct competitors?
- Considering these factors, what is the direction of the industry?
Five Forces analysis requires significant and accurate research and analysis to populate each element meaningfully. This is where the investment in primary research—expert interviews, customer conversations, competitor profiling—pays for itself many times over. A Five Forces analysis built from secondary sources alone is unlikely to surface the insights that change investment decisions.
SWOT Analysis: The Accessible Complement
While Porter’s Five Forces provides a market-level structural assessment, SWOT analysis (Strengths, Weaknesses, Opportunities, Threats) offers a company-level view that is immediately actionable for deal teams. We deploy SWOT for both the target and the top three to five competitors to create a comparative view of strategic positioning.
The real power of SWOT in a CDD context is in the cross-referencing. When a target’s stated ‘strength’ doesn’t hold up against the competitive set—or when a competitor’s ‘weakness’ turns out to be an area where they’re actively investing—the deal team gets a much more honest picture of the landscape than what seller materials provide.
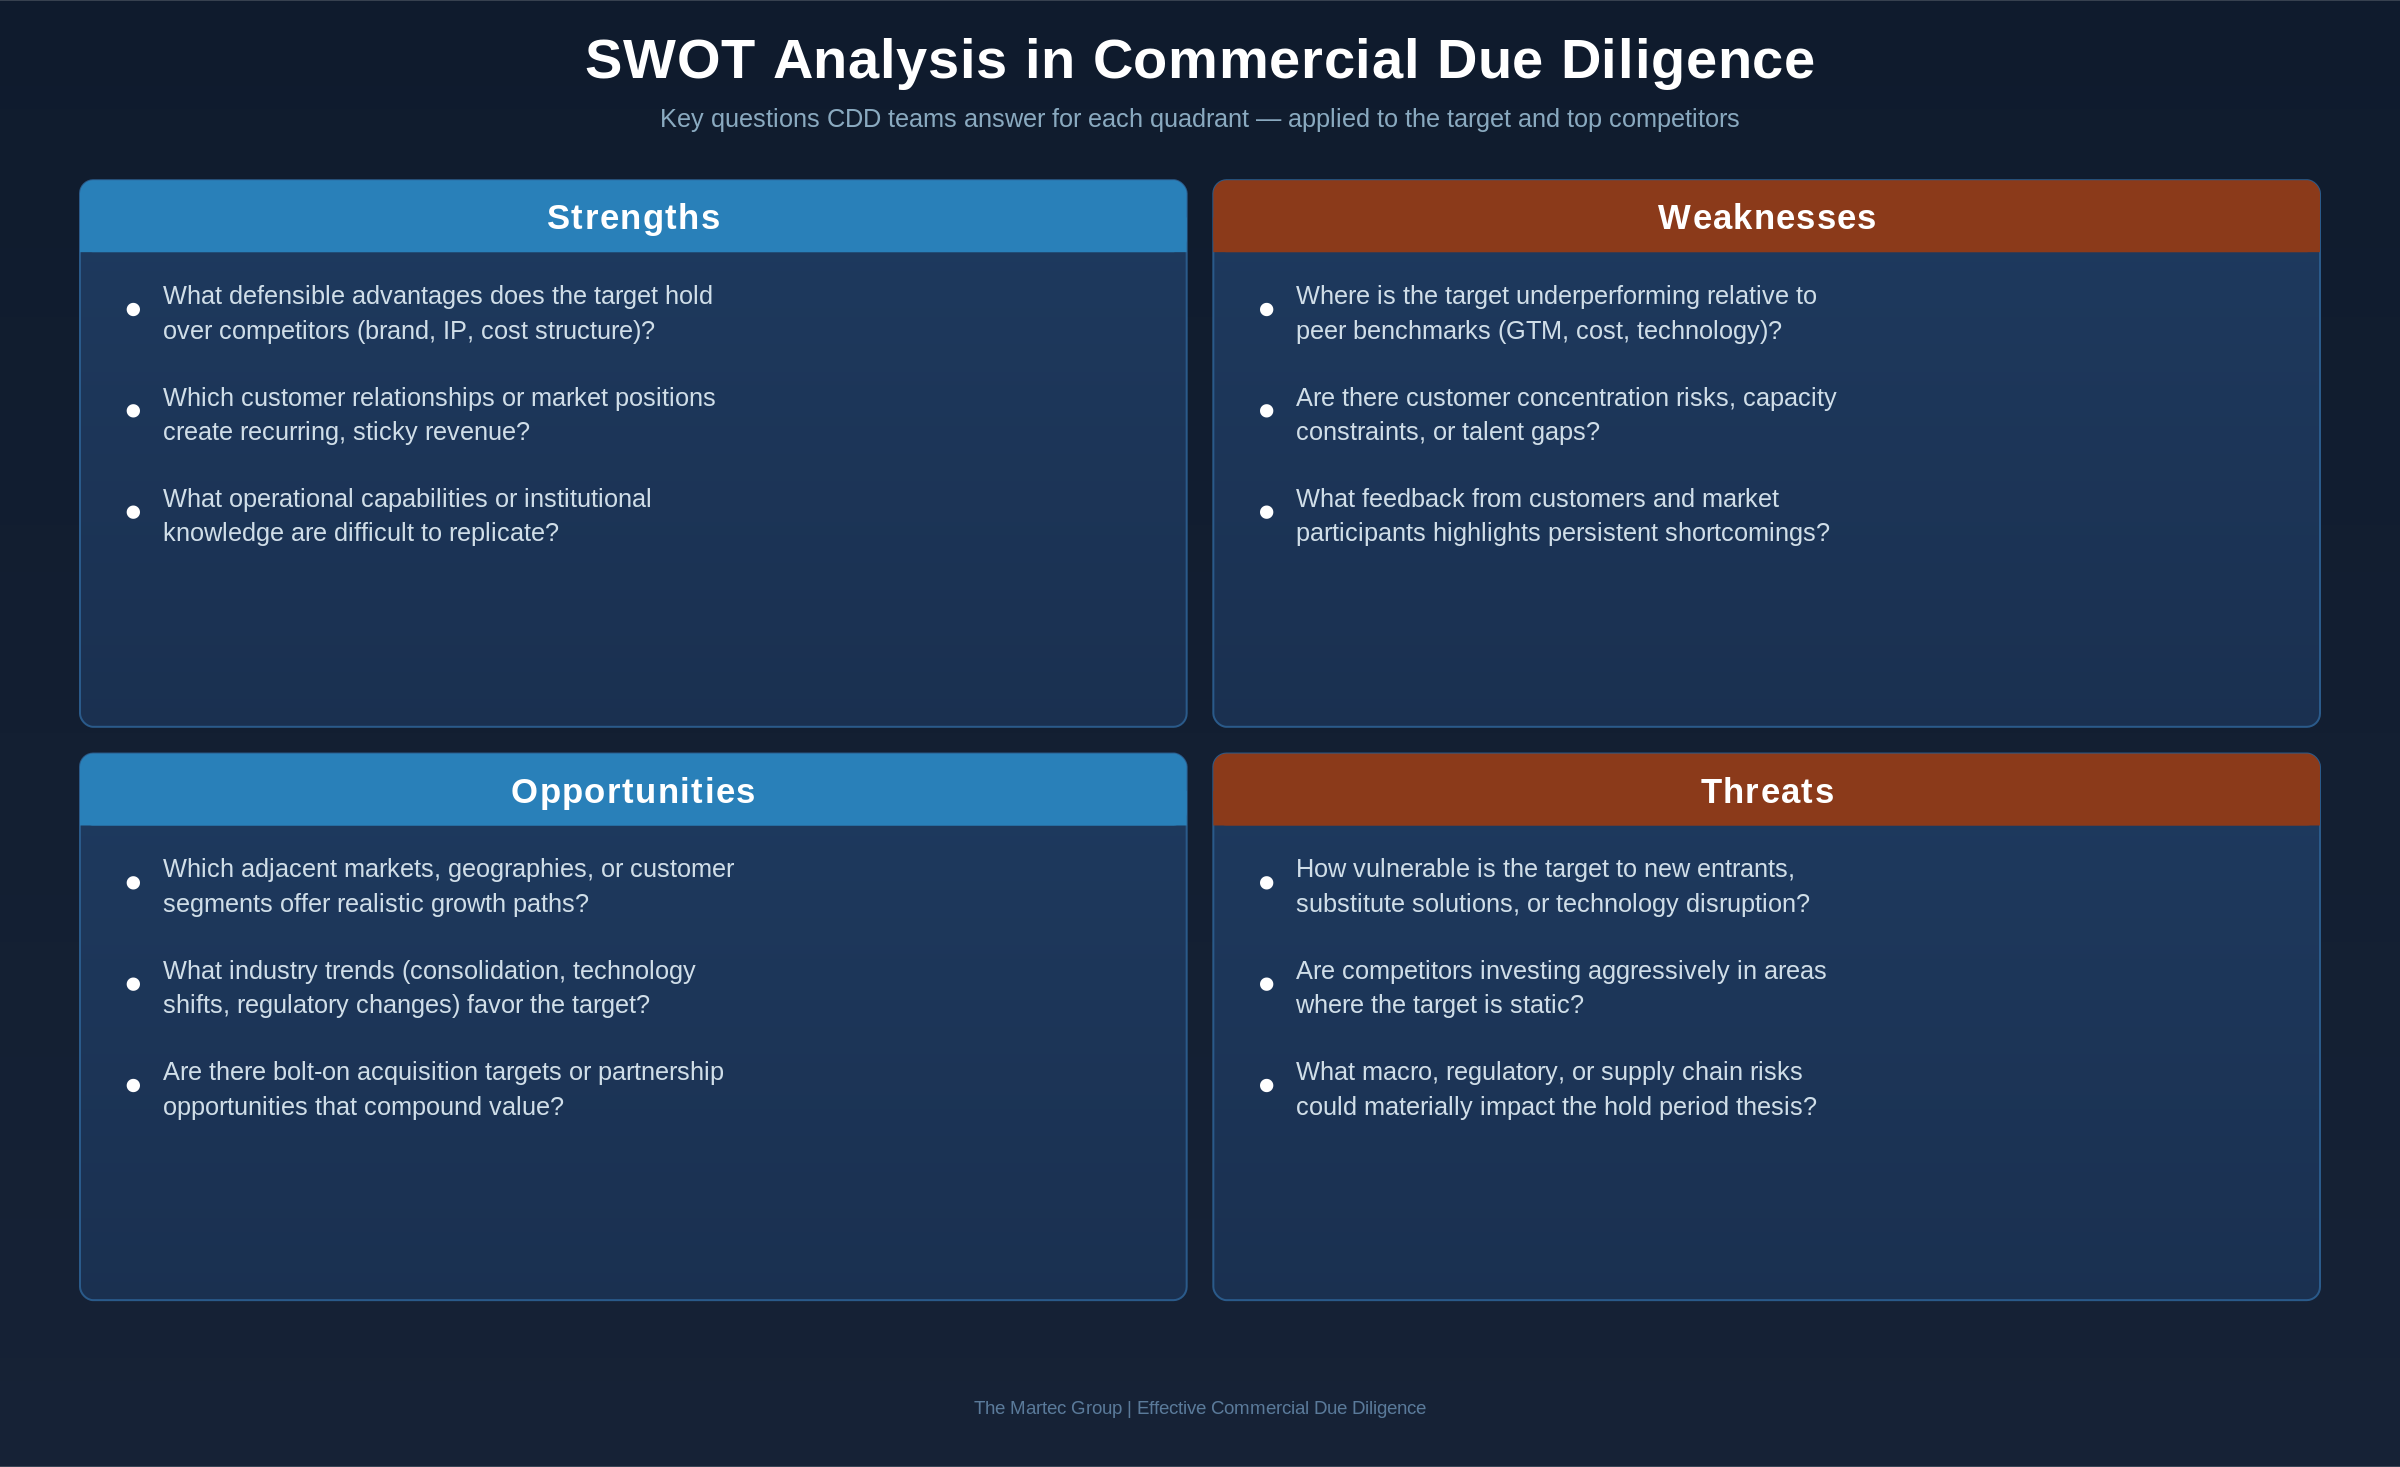
Figure 6: SWOT Analysis Framework Applied to CDD—Key Questions by Quadrant
In practice, we have found that the most valuable SWOT analyses are those built from primary research rather than desk work. When you interview customers, competitors, and industry experts, the strengths and weaknesses that emerge are grounded in real-world perception rather than seller narratives. A target may claim ‘superior customer service’ as a strength, but if customer interviews reveal inconsistent delivery times and difficulty reaching support, that narrative collapses quickly. The comparative SWOT gives investors a calibrated view of where the target genuinely excels and where competitors have the advantage.
Deep Competitive Benchmarking
Beyond the strategic frameworks, there is substantial value in the straightforward operational comparison of how competitive firms match up across key performance dimensions. Benchmarking helps investors answer the most practical questions about how the target operates relative to peers—and where specific improvements can drive margin expansion or revenue growth post-close.
The benchmarking dimensions that surface the most useful findings include:
| Benchmarking Dimension | What It Reveals |
| Pricing & Contract Format | How competitors price their solutions (model and level by region), contract structures, and the target’s relative price positioning in the market |
| Cost-of-Goods-Produced | Structural cost differences that explain margin differentials and identify efficiency opportunities for the target post-acquisition |
| Go-to-Market Strategy | Headcount allocation, sales tools and technology stack, channel strategy, marketing investment, and the effectiveness of each approach |
| Equipment & Technology | Capital intensity, technology adoption, and the state of operational infrastructure relative to competitors |
| Intellectual Property | Patent portfolios, proprietary processes, trade secrets, and the defensibility of the target’s technical position |
| Geographic Footprint | Location of facilities, service areas, and distribution networks—and how these compare to competitors’ coverage |
| Solution / Product Basket | Breadth and depth of offering relative to the competitive set, identifying gaps and opportunities for expansion |
| Positioning & Brand | How the target is perceived vs. competitors across key buying criteria—quality, reliability, innovation, service |
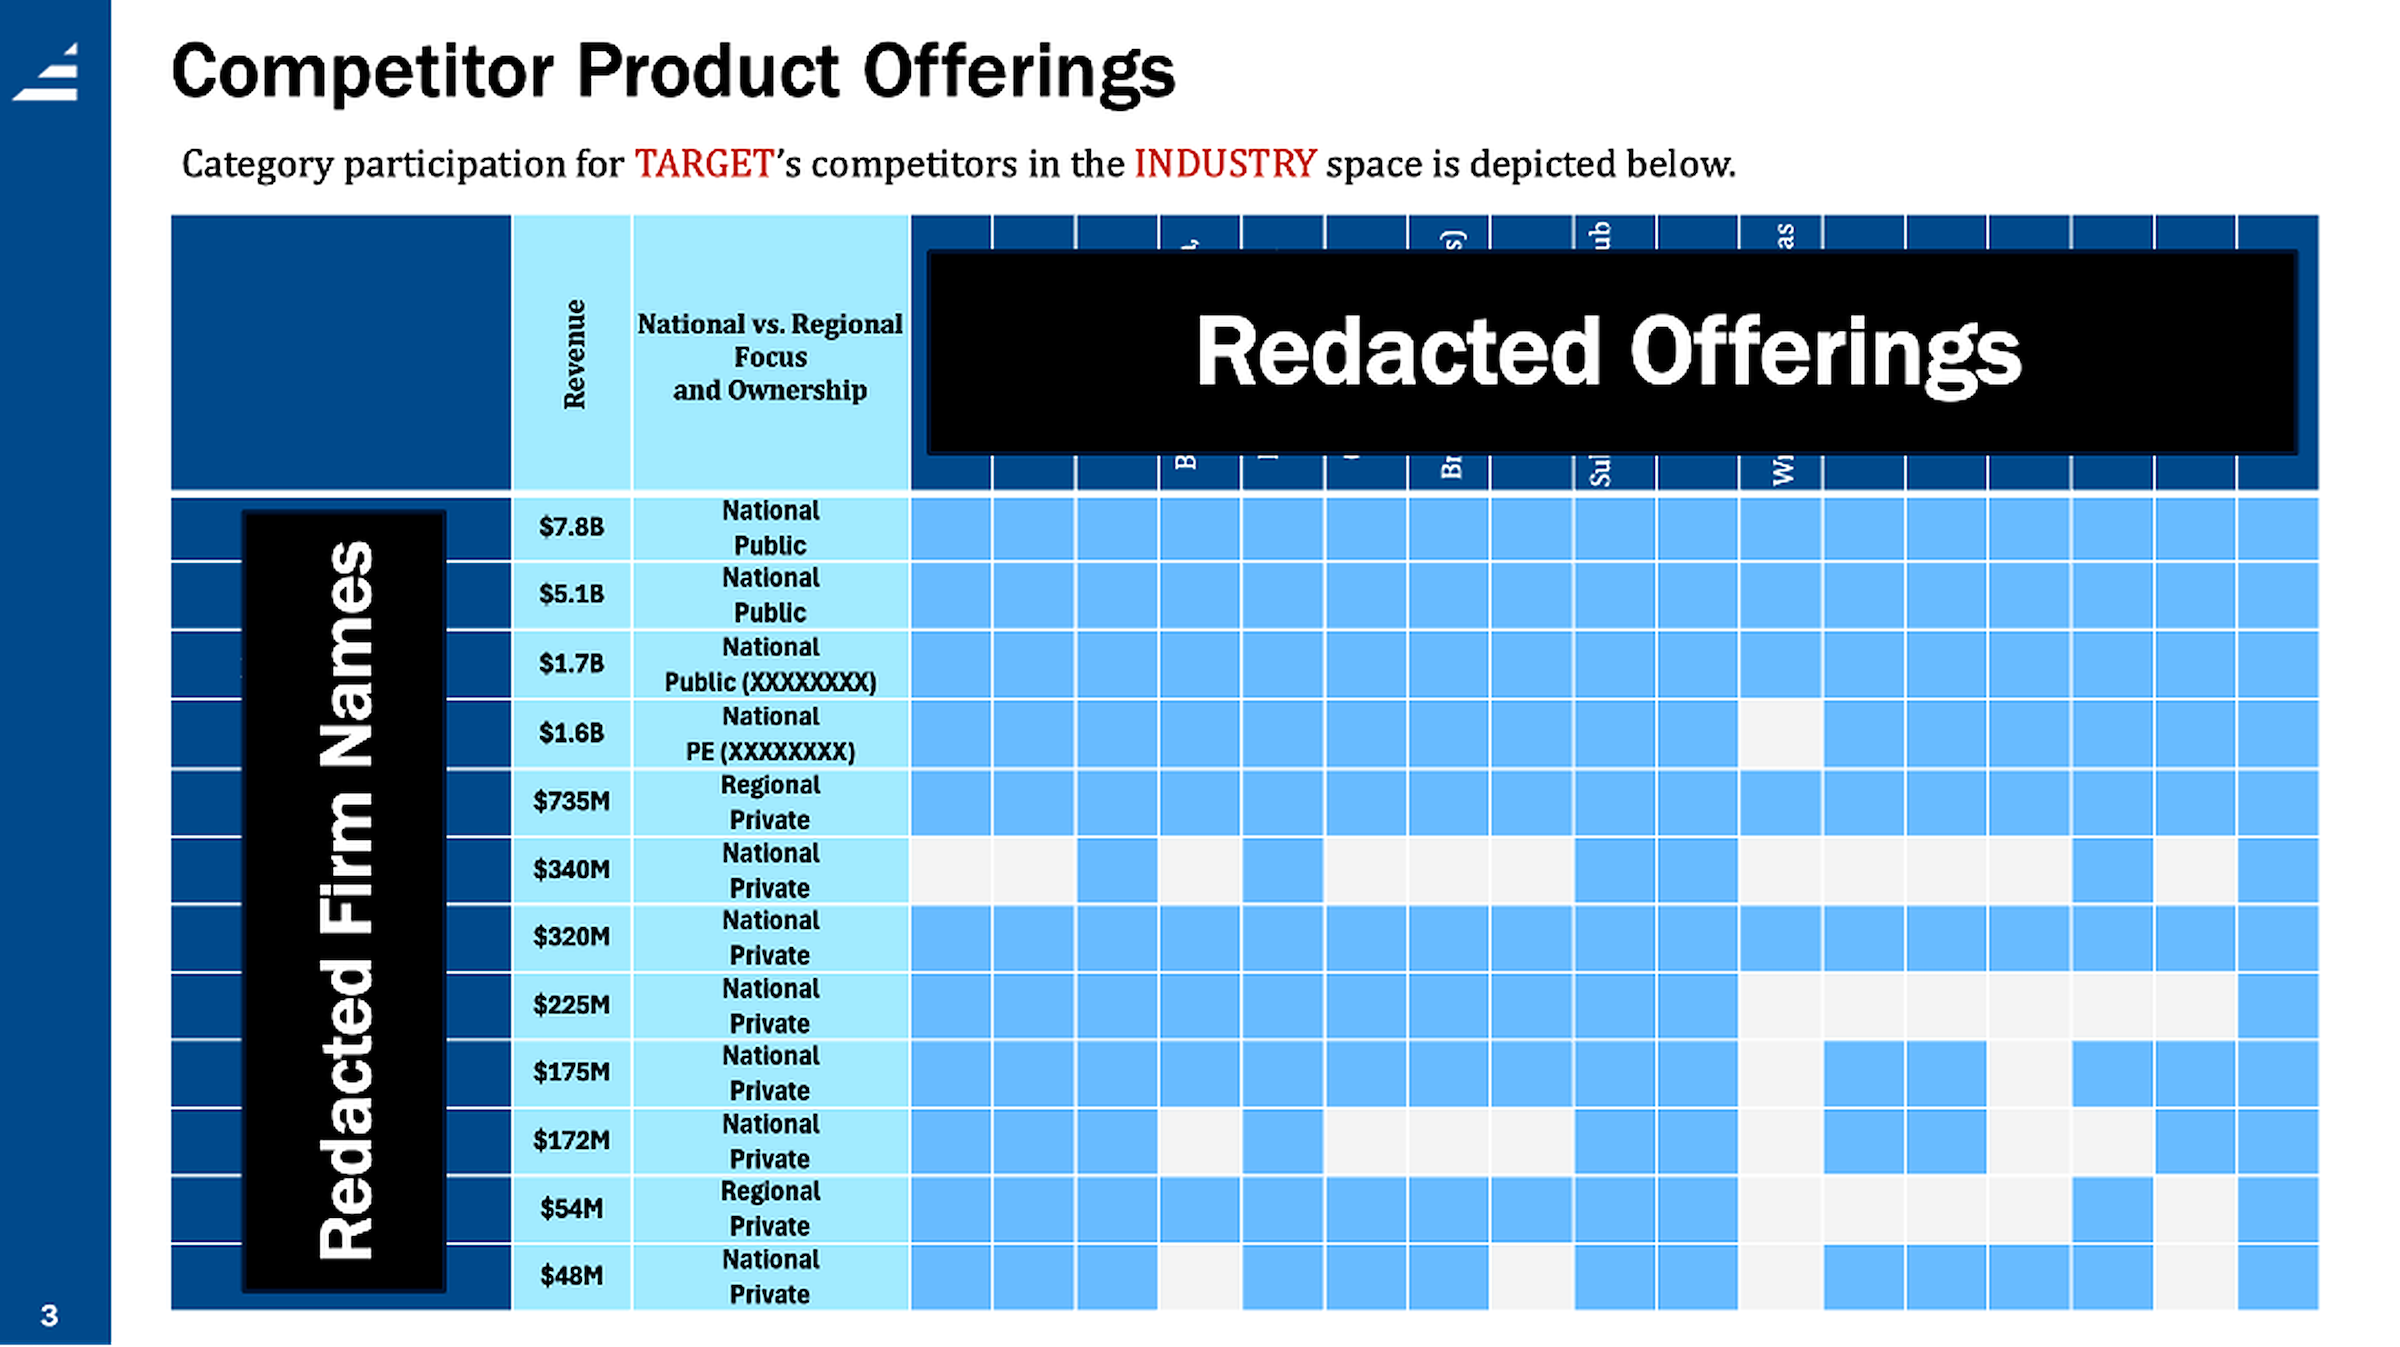
Figure 7: Competitor Product Offerings—Category Participation Matrix (Redacted Example)
In Practice: When Benchmarking Reveals the Sales Engine Is Underpowered
One of the most common findings in our competitive benchmarking work is that targets are chronically understaffed on sales and marketing relative to their competitive set. This is especially prevalent in founder-led and lower-middle-market businesses where growth has been driven by relationships and referrals rather than a systematic go-to-market engine.
In a recent engagement, we benchmarked a target’s go-to-market operation against its top five competitors across several dimensions: sales headcount relative to revenue, marketing spend as a percentage of revenue, technology stack (CRM, marketing automation, lead scoring tools), channel strategy, and the cost-per-lead-to-lifetime-value ratio that indicated scalability.
The benchmarking revealed that the target was operating with roughly half the sales headcount of comparably-sized competitors and was spending a fraction of what peers invested in digital marketing and demand generation. Competitors that had invested in modern sales tools and structured outbound programs were growing at nearly double the rate. More importantly, those competitors had predictable unit economics—they knew what it cost to acquire a customer and what that customer was worth over the relationship.
For the investor, this was not a red flag—it was an opportunity. The benchmarking data provided the operating team with a clear roadmap: which channels and tactics successful competitors used, what level of sales investment was typical for businesses at this stage, and what systems and tools needed to be in place to scale efficiently. The competitive intelligence gave the incoming operators confidence that a defined set of investments in people, tools, and spend would yield predictable growth—because they could see it working at peer firms across the landscape.
Using Competitive Intelligence to Build the Inorganic Growth Playbook
One of the most immediately actionable outputs of competitive intelligence in CDD is the development of an M&A funnel for inorganic growth planning. For investors pursuing a buy-and-build thesis, understanding the competitive landscape is not just about assessing the target—it is about identifying the next set of acquisitions that will compound value.
M&A Funnel Assessment
A strong M&A funnel starts with a prioritized target matrix built from analysis of the competitive landscape for bolt-on and tuck-in opportunities that align with the investor’s thesis. This analysis considers:
- Strategic fit with the platform’s existing capabilities, geography, and customer base
- Financial profile and likely valuation range based on competitive positioning
- Operational overlap and potential synergies (customers, solutions, footprint, GTM, suppliers)
- Cultural and management compatibility signals
- Availability and likelihood of transaction (owner age, growth trajectory, competitive dynamics)
When competitive intelligence is done well, the investor leaves the diligence phase not only with conviction about the platform but with a shortlist of high-priority add-on targets and a clear rationale for each. In a recent industrial services engagement, our competitive landscape mapping identified 23 viable bolt-on targets across three adjacent geographies. The investor used this pipeline to close two add-on acquisitions within the first 18 months of the hold period, growing the platform’s revenue by over 30% inorganically.
Flow of Money Analysis
A complementary lens is what we call the ‘Flow of Money’ analysis. This involves mapping M&A transactions within the competitive landscape: who acquired whom, when, at what multiple, and what that tells us about the strategic direction of the space. This analysis reveals several important signals:
- Which investors are active in the space and may be competitive bidders for future add-ons
- What valuation multiples are being paid for comparable businesses (benchmarking the deal against recent transactions)
- Whether the market is consolidating (which can strengthen the platform thesis) or fragmenting (which may indicate structural challenges)
- Where strategic acquirers see value, which can inform exit planning even at the time of initial investment
In one specialty chemicals engagement, we tracked 41 transactions over a 30-month period, revealing that a single strategic acquirer had quietly assembled a portfolio of five competitors. That intelligence reshaped the investor’s exit planning timeline—knowing who the likely buyer would be changed the growth story entirely.
A Note on Ethics: What’s Appropriate and What Isn’t
There are misconceptions about competitive intelligence research, so it is important to understand what is possible and knowable within the context of an approach that is legal, ethical, and appropriate.
Working with a consultant who follows SCIP (Strategic Consortium of Intelligence Professionals) standards is not optional—it insulates your team from risk and ensures your research will withstand scrutiny.
Tactics and objectives that classify as corporate espionage are always prohibited. This includes misrepresentation of identity to extract proprietary information, theft or procurement of trade secrets, unauthorized access to confidential systems or documents, and any research methodology that would not withstand legal scrutiny. The line between aggressive competitive intelligence and corporate espionage is not always intuitive, which is precisely why engaging an experienced and ethics-bound consultant matters.

Meanwhile, at the firm that didn’t hire an ethics-bound consultant…
SCIP Ethical Standards
- All competitive intelligence must be gathered through legal and ethical means.
- Researchers must accurately identify themselves and their purpose when engaging sources.
- Proprietary or confidential information must never be obtained through deception or coercion.
- The competitive intelligence function should comply with all applicable laws and regulations.
- For more detail, see SCIP’s Ethical Intelligence Guidebook and supporting materials.
Bringing It Together: How Competitive Intelligence Changes Outcomes
Competitive intelligence is not a nice-to-have module in commercial due diligence—it is the contextual foundation upon which market sizing, customer intelligence, and growth assessments gain their meaning. Without understanding the competitive field, you are estimating growth in a vacuum.
When conducted with rigor and expertise, competitive intelligence in CDD delivers outcomes that go far beyond a slide deck of competitor profiles. It informs pricing strategy, validates (or refutes) the durability of the target’s moat, builds an actionable inorganic growth pipeline, and—most importantly—gives the investment committee the confidence to make a well-informed decision.
When the leverage is high, the risk is proportionately high. The traditional LBO is in a position to benefit disproportionately from quality diligence services. The nominal fees of commercial due diligence are worth their weight in gold when they help an investor dodge a bullet, provide the evidence for a repricing event, or deliver directly actionable intelligence to pursue value creation in the hold period.
What’s Next
In the next installment, we’ll walk through customer intelligence—the primary research methodology that surfaces the insights competitive share data alone can’t provide. We’ll cover how to design a customer interview program that separates signal from noise, the questions that consistently reveal the most about competitive dynamics, and how to synthesize qualitative evidence into investment-grade conclusions.
If you’re evaluating a deal and want a sharper view of the competitive landscape, contact us and we’ll review your situation and provide the best guidance we can offer. Every year we conduct numerous strategic due diligence projects carefully tailored to the exact specifications and information needs of our private equity clients.
References & Further Reading
- Porter, Michael E. Competitive Strategy: Techniques for Analyzing Industries and Competitors. Free Press, 1980.
- Greenwald, Bruce. Competition Demystified: A Radically Simplified Approach to Business Strategy. Portfolio, 2005.
- Magretta, Joan. Understanding Michael Porter: The Essential Guide to Competition and Strategy. Harvard Business Review Press, 2012.
- SCIP Ethical Intelligence Guidebook. Strategic and Competitive Intelligence Professionals.