


What separates a market size you can defend from one you just cite?
There is a number that appears in nearly every investment thesis, growth plan, and board presentation: the total addressable market. It is cited with confidence, displayed in slides, and used to justify headcount decisions, acquisition multiples, and capital allocation. It is also, in a significant share of cases, wrong.
Not wrong in a minor, rounding-error way. Wrong in a way that sends a company chasing a market that doesn’t exist at the scale assumed or worse, ignoring a market opportunity that is far larger than their current definition allows. The consequences are real: capital misallocated, growth theses that fail on contact with actual customers, and deals that look considerably less attractive 18 months post-close than they did in the data room.
The problem isn’t that companies lack a market size estimate. It’s that most have exactly one — a single number, from a single source, validated by nothing but the authority of whoever published the research report. That is not a TAM. That is a placeholder dressed up as a fact.
The Overestimation Trap: When Macro Numbers Mislead
The most common path to a market size number runs through a third-party research report. An analyst firm publishes a global market projection, someone on the strategy team pastes the headline figure into a deck, and it becomes the organization’s working definition of opportunity.
The problem is what those figures actually represent. Analyst reports describe macro categories: the global industrial automation market, the North American commercial HVAC sector, the U.S. residential remodeling industry. These are broad, supply-side constructs that aggregate spending across geographies, customer types, and product definitions that may have little relationship to what a given company can realistically serve.
For example, a manufacturer of precision components for a specific industrial application cannot compete for the entire “industrial automation market.” Or a regional roofing contractor does not have a realistic claim on every dollar spent on roofing in the U.S. But the TAM in the deck often implies otherwise by flattering the opportunity, inflating confidence in the growth thesis, and insulating leadership from the harder question: what portion of this market can we reach, win, and serve?
In a private equity context, this dynamic becomes particularly consequential. A target company enters diligence with a $14 billion TAM and a 1.2% market share, implying enormous runway. Commercial due diligence reveals that the realistic addressable segment — accounting for geography, customer fit, and competitive dynamics — is closer to $2.5 billion. The growth story doesn’t disappear, but the math on achieving a 20% IRR looks considerably different.
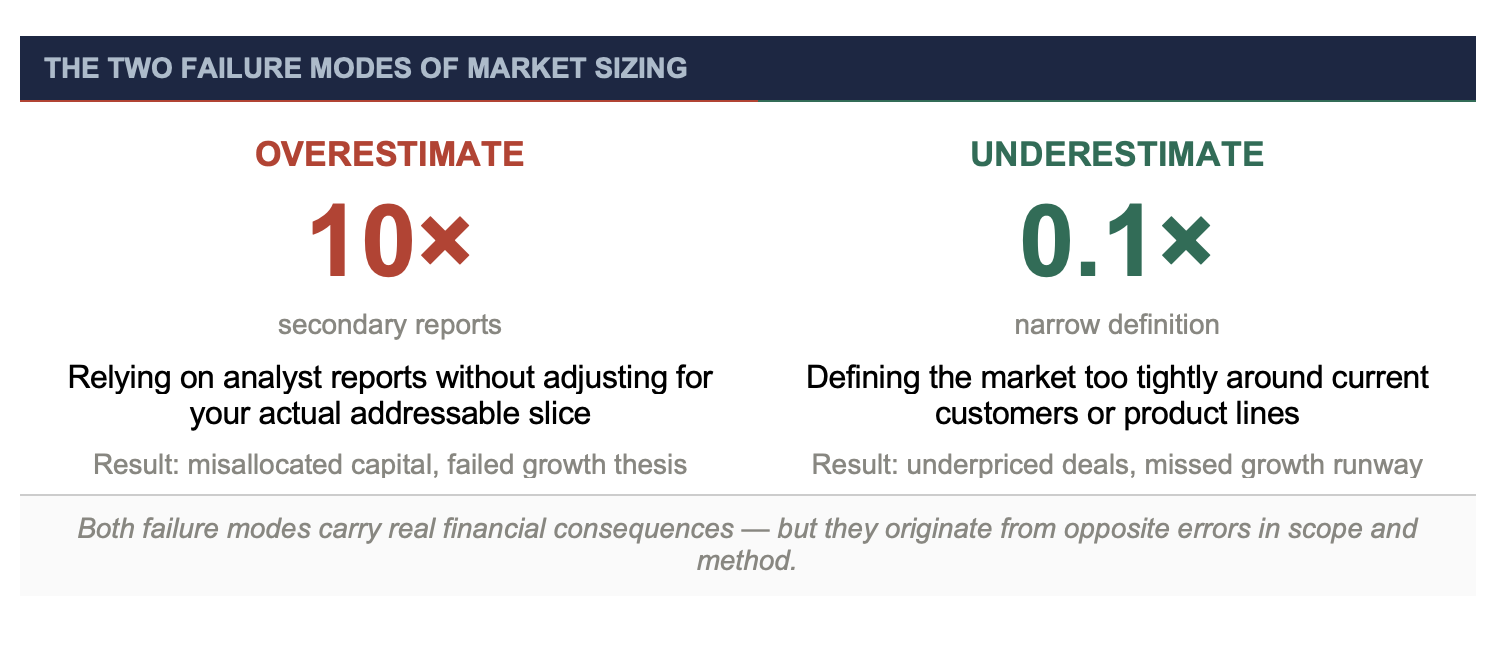
The Underestimation Problem: Defining the Market Around What You Already Sell
The opposite error is less discussed but equally consequential, particularly in M&A and growth strategy. Companies that define their market based on their current product lines, existing customers, or historical revenue categories systematically undercount the opportunity in front of them.
Consider a company in the building products space that defines its market as the segment it currently competes in — say, mid-range residential windows. In doing so, it may miss adjacent categories it could serve with modest product adaptation, customer segments with the same unmet need it isn’t currently reaching, and geographic markets where distribution expansion is feasible.
For someone evaluating or holding that business, an underestimated TAM creates a different kind of problem: the growth thesis gets scoped around incremental share gains within a narrow definition, rather than growing revenue through market expansion. The most valuable businesses aren’t the ones that captured more of the same market. They are the ones that redefined what their market was.
Getting this right isn’t about being aggressive with the numbers. It’s about defining the market around customer need rather than company history — and that requires going to the market directly, not inferring the answer from internal data alone.
Why One Source Is Never Enough
Market size is not a fact waiting to be looked up. It is an estimate, a structured inference from imperfect information. The most rigorous approaches treat it exactly that way, building confidence through triangulation rather than citation.
I often compare market sizing to doing a jigsaw puzzle without the box top. You know there’s a picture there, but you don’t know what it looks like until the pieces start coming together. The more pieces you can find, the clearer — and more reliable — the picture becomes.
In practice, that means combining three distinct lenses:
Published secondary research sets a ceiling, often based on the broadest plausible definition of the market. This can be useful as a starting point but is limited by how quickly it becomes outdated and how broadly it defines the category.
Bottom-up primary research from buyers, specifiers, and decision-makers reveals what was purchased (often at a very granular level) and sets a floor. It represents the market as experienced by the people who make purchasing decisions.
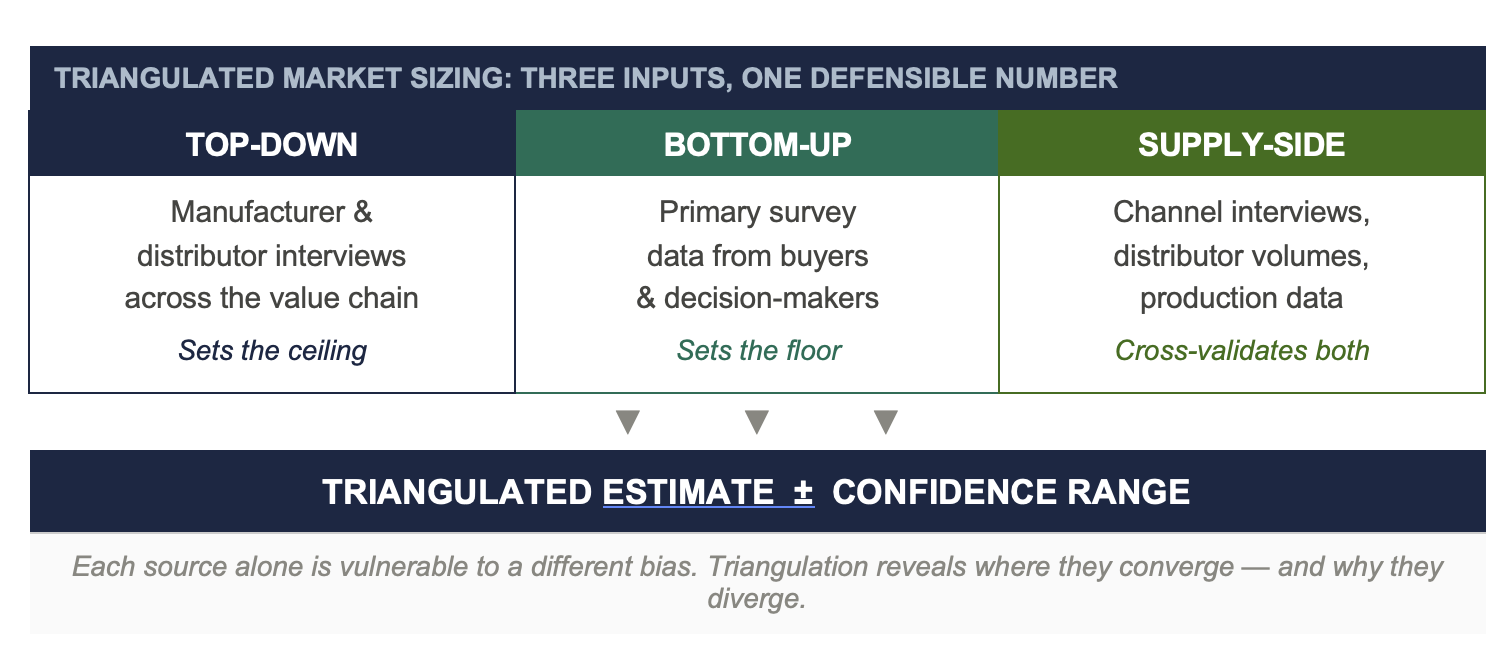
Top-down research focuses on what was sold by interviewing respondents throughout the value chain, including manufacturers, distributors, and channel partners to understand actual volume and share from the supply side. This requires multiple information sources and robust corroboration. Think of it as a reporter seeking secondary sources to verify every lead and every piece of evidence. The more exhaustive the top-down work, the more diligent the corroboration of everything else.
Top-down market sizing research is almost always qualitative in nature, and it requires access to the right people. Done well, it means exploring the complete value chain and understanding who controls the market, who the secondary players are, what share each holds, and who (or what) is driving growth or change. Public filings can surface useful clues, while trade associations, analysts, and sector consultants fill in what major players either cannot or will not share directly.
The 80/20 rule applies here as well. In many markets, 20% of businesses control 80% of the volume. Getting the market leaders into the conversation through in-depth qualitative interviews is not optional. It is where the most reliable supply-side intelligence lives.
We take nothing as gospel. There’s an old saying in journalism: “If your mother tells you she loves you, verify it.” We live by a similar edict and believe a fully triangulated approach exposes false claims and erroneous assumptions which can provide faulty intelligence and jeopardize every decision made downstream.
When all three sources converge within a reasonable range, the market size estimate earns credibility. When they diverge, that divergence is itself information: something about the market’s structure, its definition, or how it’s being measured is misaligned. Understanding that misalignment can provide to a more accurate answer.
In multiple recent engagements, our triangulated estimate has differed from the company’s internally-used figure by 30 to 60 percent in either direction. That is not a rounding difference. That is a strategic difference with direct implications for capital allocation, pricing strategy, and growth planning.
The Precision Trap: When a Specific Number Signals False Confidence
There is a particular danger in the specificity of analyst-sourced figures. “The market will reach $47.3 billion by 2028” reads like a precise, well-grounded estimate. It usually isn’t. The decimal point implies a level of accuracy the methodology doesn’t support. And because the number is specific, it tends to discourage scrutiny. The false precision reads as rigor, even when the two have nothing to do with each other.
A triangulated market size estimate that returns a vetted range (let’s say, $28 to $34 billion, including explicit confidence bounds and defined assumptions) is more honest and, ultimately, more actionable. It tells you not only what the market probably is, but where the uncertainty lives and what would have to be true for the upper or lower bound to be the right answer. That is the information that informs scenario planning, investment theses, and risk management.
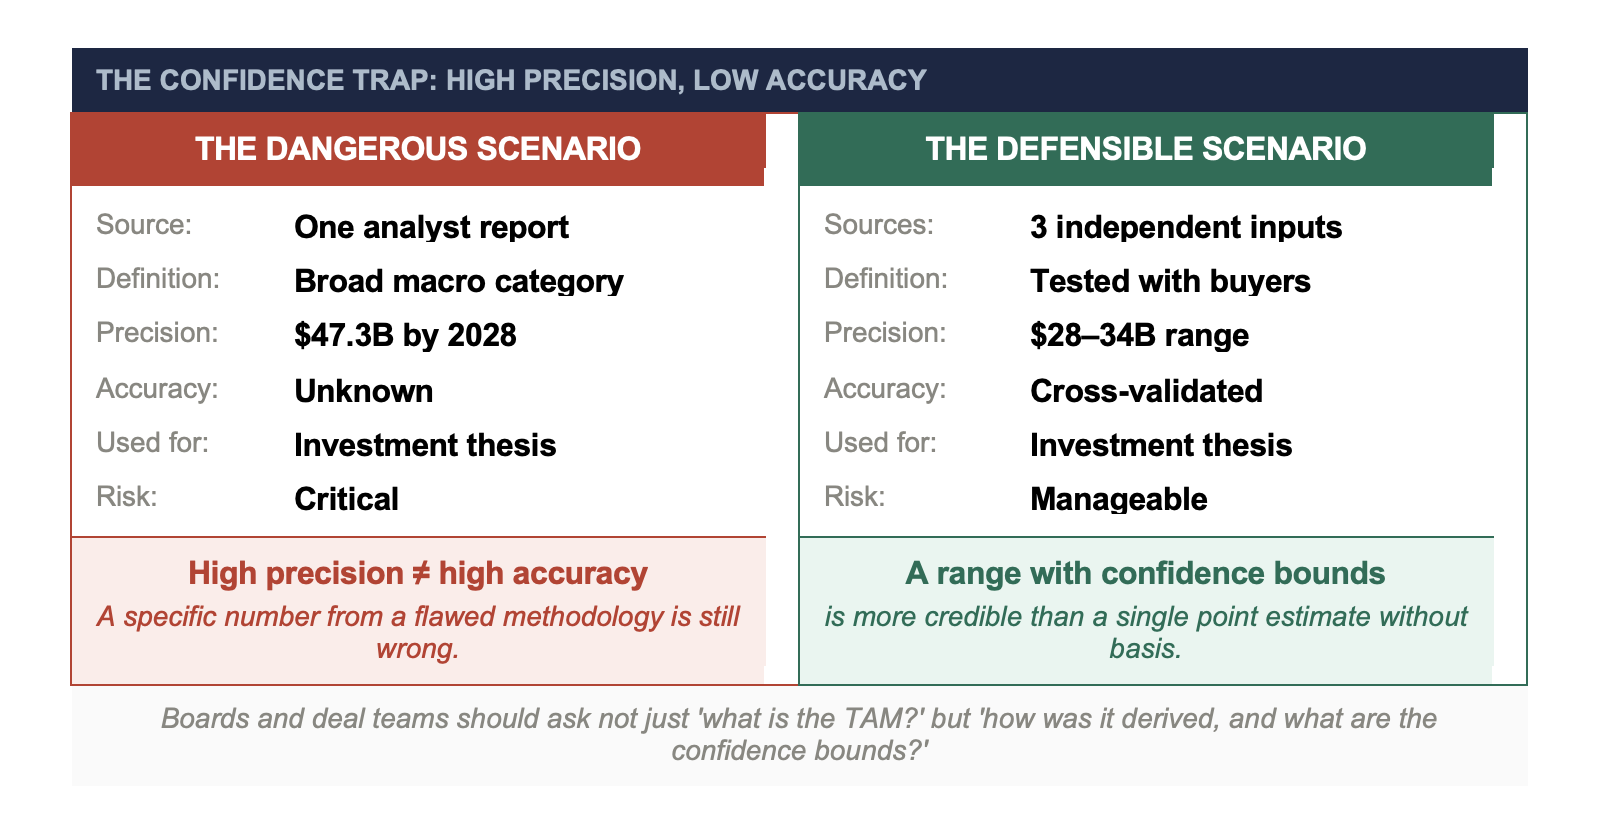
Corporate decision makers and PE deal teams should ask not only “what is the TAM?” but also “how was it derived, and what are the confidence bounds?” A company that can answer the second question is operating from a fundamentally stronger position than one that can only answer the first.
What the Most Rigorous Teams Do Differently
The highest-performing PE teams and corporate strategy functions share a common practice: they treat market sizing as an active research question, not a number to source and file. They commission primary research alongside secondary analysis. They pressure-test TAM assumptions with channel partners and end customers. They ask their portfolio companies to show their work.
They also revisit market size estimates on a cadence that reflects how quickly the market is evolving. As an example, a study completed three years ago may have been rigorous when conducted, but irrelevant today. Over time (and often within a very short timeframe) markets restructure, customer definitions shift, and competitive dynamics change the boundaries of what’s contestable. The original market size estimate should not be treated as a permanent artifact, but rather as a living input into ongoing strategic decisions.
Successful teams also have discipline around what questions the research is designed to answer. They don’t treat a market size as a single number, but as a family of numbers, depending on what is being measured: total spend in a category, spend by customers you can realistically reach, spend by customers who have the problem you’re positioned to solve, spend currently going to competitors you can displace. Each definition implies a different investment thesis, different go-to-market strategy, and different risk profile. Collapsing them into one TAM figure loses information that matters.
The Stakes Are High Enough to Get This Right
A market size number that goes unchallenged becomes institutional knowledge. It shapes how leadership frames the opportunity, how the board evaluates performance against potential, and how acquirers think about the platform. When it is wrong, the distortion propagates through every decision it touches.
The firms that consistently make better capital allocation decisions, whether for M&A, decisions, organic growth, or go-to-market investment, don’t have access to better reports. They consistently do the harder work of going to the market directly, triangulating from multiple sources, and building estimates they can defend with rigor. That discipline is not a luxury for organizations with large research budgets. It is a prerequisite for making decisions you can stand behind.
Ken Donaven is a Partner with The Martec Group. He can be reached at ken.donaven@martecgroup.com.
Tatyanna Dadabbo is a Senior Project Manager with The Martec Group and can be reached at tatyanna.dadabbo@martecgroup.com.