

For many organizations, the question isn’t whether they provide value, but whether that value is recognized and aligned with customer needs. Brands often sense underperformance in the market: sales are lagging, marketing isn’t resonating, or competitors seem to be gaining traction despite offering what appear to be inferior products. In other cases, there may be internal ambiguity: sales teams, distributors, and end-customers all perceive the brand differently.
When that happens, traditional sales or marketing fixes may not be enough. What’s needed is a clearer picture of the root cause—where exactly the disconnect lies between how a company thinks it is performing and how customers and partners actually perceive its value.
This is where Brand Mapping often comes in, to replace ambiguity with clarity. By plotting perceptions of brand performance against attributes such as price, quality, service, or technical support, Brand Mapping visualizes a brand’s true position in the competitive landscape. More importantly, it identifies the levers a company can pull—whether operational, strategic, or financial—to better align with customer expectations and drive growth.
What Is Brand Mapping?
At its core, Brand Mapping is the practice of translating customer perceptions into actionable insights and visuals that demonstrate how a brand compares to competitors. These maps can take different forms, but all share a common goal: to link brand perception to measurable business outcomes.
There are multiple approaches to brand mapping:
- Attribute-Specific Mapping
Companies can isolate two key attributes—say, quality versus service or price versus technical support—and chart how they and their competitors perform across those dimensions. This simple but powerful view often uncovers misalignments. One brand may excel in quality but lag in service, while another does the opposite. - Price-Value Mapping (PVM)
Often considered the most comprehensive approach, Price-Value Mapping looks at overall brand satisfaction relative to perceived pricing. Brands are plotted along a “fair value” diagonal line, which represents price neutrality: the point at which perceived value and actual price align. Those above the line risk being seen as overpriced relative to performance (price skimming), while those below may be underpricing the value they actually deliver (penetration pricing). - Qualitative and Quantitative Approaches
Mapping can be rooted in verbatim qualitative feedback—comments like “great quality, but support doesn’t measure up”—or in quantitative survey data that aggregates perceptions across hundreds of respondents. Ideally, the two are combined to provide context, depth, and statistical confidence.
In practice, brand mapping often integrates all of these elements, creating a multi-layered picture of how the brand is seen, how it compares to competitors, and where opportunities exist to optimize strategy.
How Brand Mapping Works
The process begins with capturing perceptions from key constituencies. These often include:
- End-Users: The ultimate customers using the product or service.
- Sales Representatives: Those closest to customer objections and feedback.
- Channel Partners/Distributors: Intermediaries who both sell the product or service and influence customer perceptions.
By plotting responses from these groups side by side, brand mapping reveals not just how the brand is perceived in the marketplace, but also how internal and external perspectives may diverge.
For example, one client discovered that while end-users saw it as high-quality and worth a premium price…

…its own sales reps perceived its offerings as weaker in quality compared to competitors.
Going further, end-users perceived the client as offering “best in class” customer service, while its sales reps believe it offers much lower customer service than its competitors.

While the disconnect wasn’t obvious from sales numbers alone; these mismatched perceptions created brand ambiguity and hindered sales effectiveness. The Brand Mapping initiative gave our client clear direction: improve sales training, shift channel strategy, and emphasize value attributes beyond price.
As a result, the company:
- opened two new distributor training centers,
- repositioned messaging to highlight quality and availability, and
- achieved a +10% growth gap compared to the overall market.
However, the analysis doesn’t stop at perception. Spending patterns, market share, and willingness-to-pay data also can be layered in to quantify the financial implications of these perceptions. If a segment of the market believes the brand is superior in both quality and service, it becomes critical to understand why—as well as how to replicate those attributes across other customer segments.
Illustrative Example: Price-Value Mapping
Consider the Price-Value Map, where performance (often measured as brand satisfaction) is plotted against perceived price.

- Price Neutral Zone (Fair Value Line): Brands on this diagonal are perceived as priced appropriately relative to their value.
- Price Skimming (Top Left): These are brands priced higher than customers believe they’re worth. This can generate short-term profitability but risks long-term defection.
- Penetration Pricing (Bottom Right): Brands delivering more value than their price suggests may result in the ability for a brand to “buy” market share, but it can also run the risk of leaving revenue on the table.
In one case, a client consistently appeared in the “price skimming” zone. While leadership initially wanted to lower prices, a Brand Mapping study revealed that pricing wasn’t the real issue. Instead, inconsistent product quality and long lead times were eroding perceived value. The solution wasn’t to cut prices. It was to fix the operational weaknesses that would move the brand rightward on the map, back into the fair-value zone.
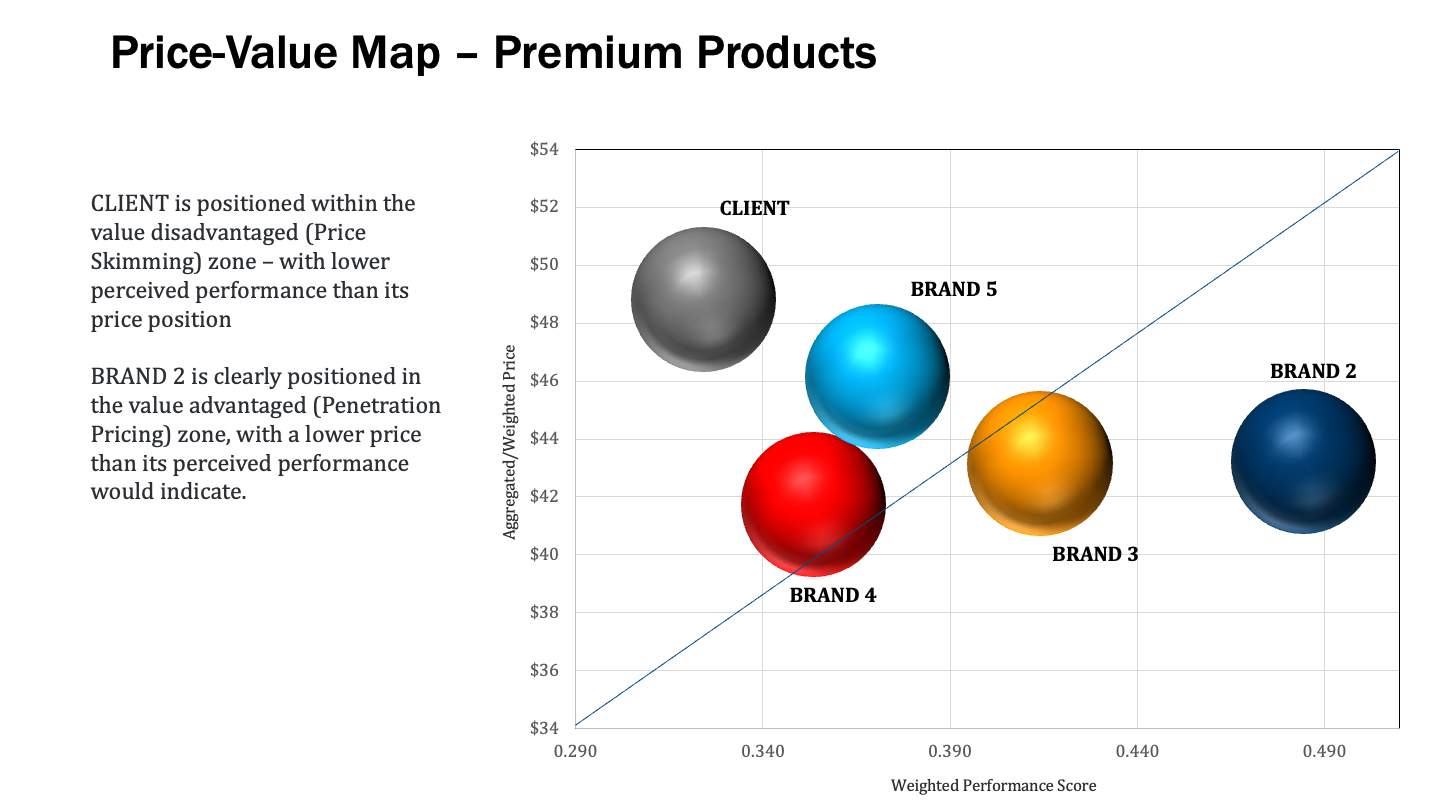
This illustrates a critical point: Brand Mapping goes beyond surface-level fixes to identify root causes. By showing where a brand sits in the customer’s mind, it dictates whether to adjust price, improve performance, or reposition entirely.
From Insights to Action: Root-Cause Analysis
One of the greatest strengths of Brand Mapping is its ability to act as a root cause analysis. When brands underperform, the instinct is often to double down on sales or marketing. But sometimes such actions are only addressing symptoms, when the issue lies elsewhere: in service, product quality, channel alignment, or even how internal teams perceive the brand compared to customers.
By visualizing perceptions across constituencies, Brand Mapping ensures resources are deployed against the true problem…not just the symptoms. This allows leadership to focus on the most impactful levers for growth.
What Successful Outcomes Look Like
Brands that conduct mapping exercises typically emerge with:
- Alignment of Value Proposition and Perception: Clearer understanding of whether customers see the brand as intended.
- Sharper Go-to-Market and Channel Strategies: Adjustments in sales messaging, training, and partner engagement.
- Improved Allocation of Resources: Investments targeted toward the attributes that matter most to customers.
- Market Repositioning Opportunities: Data-backed confidence to pursue premium pricing or performance enhancements.
- Revenue Growth and Market Share Gains: As seen in the consumables case study, Brand Mapping often translates directly into measurable financial results.
Ultimately, successful Brand Mapping delivers more than a snapshot of perception. It provides actionable intelligence to strengthen competitive advantage.
Remove Doubt, Guesswork, and Ambiguity
In today’s hyper-competitive markets, brands can’t afford to operate on hunches. Brand Mapping, when done effectively, has the power to transform customer perceptions into clear, data-driven insights that reveal, not only where a brand stands, but also where it needs to go.
By uncovering gaps between brand intent and audience perception, isolating root causes of underperformance, and guiding strategic adjustments, Brand Mapping equips businesses with clarity and confidence. The outcome is sharper messaging, stronger channel execution, and sustainable growth.
Ken Donaven is a Partner with The Martec Group. He can be reached at [email protected]. If you would like to explore how Brand Mapping can help clarify your value proposition, uncover performance gaps, and chart a course for growth, please don’t hesitate to reach out.